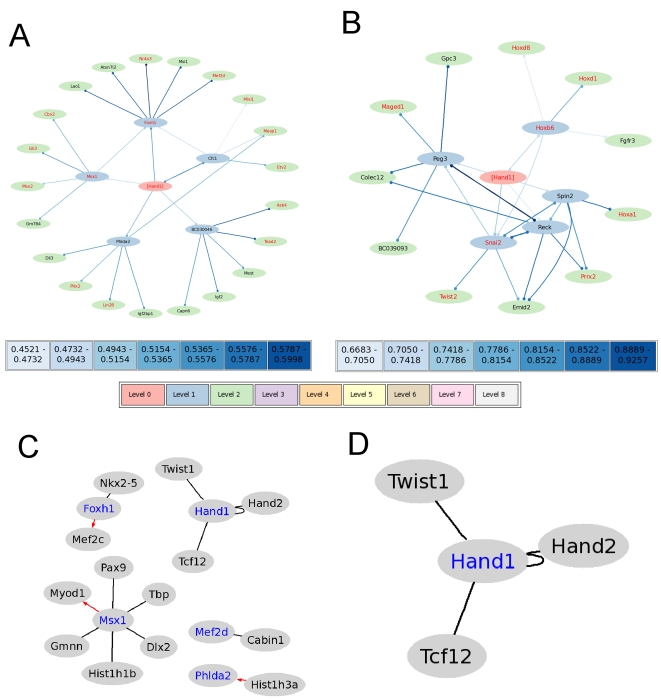
Figure 3. Representative graphical output from StarNet (textual output not shown).
a: Full cohort correlation network with Hand1 as the central node. b: Cardiac cohort correlation network with Hand1 as the central node. c: Known associations involving genes from a (which appear in blue text). d: Known associations involving genes from B (which appear in blue text). In a and b, red text indicates genes with annotation that include “transcription”, and line color represents correlation strength as indicated by the scale bars. In c and d, black edges represent previously known protein-protein interactions, and red arrows represent previously known protein->DNA interactions. Known interactions for all genes in each correlation network are determined by searching Gene RIF interactions supplied by Entrez Gene.

