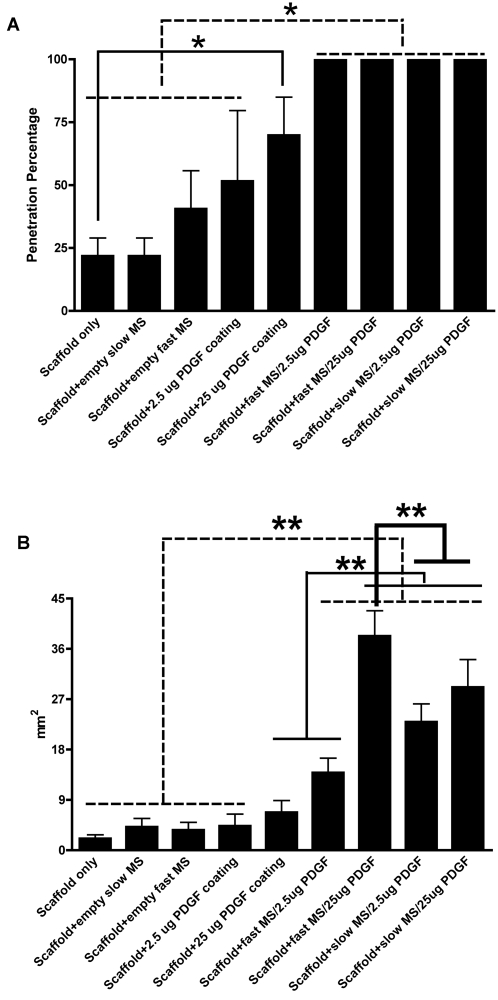
Figure 2. Histomorphometric analysis results of PDGF-inducing tissue penetration and neogenesis.
A is percentage of tissue penetration. The percentage of tissue penetration within the groups of PDGF encapsulated in PLGA MS was statistically greater than that for the other groups with the exception of the 25 µg PDGF coating group. The percentage of tissue penetration in the 25 µg PDGF coating group is significantly greater than for the NFS only group. B demonstrates the areas for all groups. The areas in the groups for PDGF encapsulated in PLGA MS are statistically greater than those in the groups for NFS only, NFS containing empty, slow, and fast release PLGA microspheres, and 2.5 µg PDGF coating group. The groups with 2.5 µg PDGF encapsulated in slow release PLGA microspheres and 25 µg PDGF encapsulated in slow and fast release PLGA microspheres have larger areas than the groups with 25 µg PDGF coating and 2.5 µg PDGF encapsulated in fast release PLGA microspheres. The largest area was found in the group of 25 µg PDGF encapsulated in fast release PLGA microspheres. * indicates p<0.01, ** indicates p<0.05

