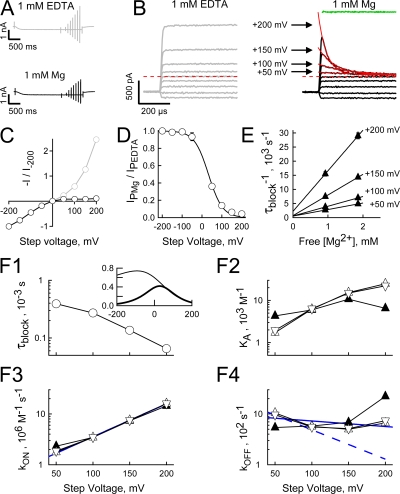
Figure 5.
Inward rectification of the open HCN2 channel current arises from a voltage-dependent block by intracellular Mg. (A and B) HCN2 currents activated at 2140 mV in the presence of 300 μM cAMP with either 1 mM EDTA plus 1 mM EGTA or 1 mM Mg plus 1 mM EGTA in the intracellular solution (records are from the same patch). In all panels K was the only alkali metal on either side of the membrane ([K]OUT 117 mM; [K]IN 119 mM or 121 mM when EDTA replaced MgCl2). After allowing activation to equilibrate (2 s), the patch was stepped to potentials between −200 and +200 mV in 50-mV intervals with test steps applied at 10 Hz (records were filtered at 100 kHz and sampled at 200 kHz). To ensure steps were long enough to determine the time constant of block but short enough to prevent deactivation, the durations of the steps were increased from 1 ms at +200 mV to 3 ms at 0 mV in 0.5-ms increments and then held at 3 ms for all negative potentials. Collection of such “active” sweeps was interlaced with “leak” sweeps wherein the patch was stepped to −140 mV for 5 ms before and after each test step (not shown for simplicity). For each condition, four averaged “leak” records were subtracted from the average of the four cognate “active” records (shown in A) and the subtracted currents aligned to the beginning of each test step (B). Activation at −155 mV with test steps applied at a lower frequency (4 Hz) gave identical results so data from these two paradigms were combined. Records collected at depolarized potentials in the presence of Mg are well fit (red lines) with a single exponential function (residuals from the fits shown as green lines offset from zero for clarity). Arrows show the correspondence between the zero time extrapolation of the fitted exponentials and the amplitudes of currents acquired in the absence of Mg. (C) Plateau tail currents (determined at the end of test steps as shown in B) in the presence (IP Mg) and absence (IP EDTA) of 1 mM Mg (mean ± SEM from nine separate recordings for each condition) plotted versus the corresponding test potential. (D) Equilibrium voltage dependence of the block by 1 mM Mg was determined by fitting Eq. 6 (smooth line) to the ratio of IP Mg/IP EDTA (same data as shown in C). The 95% confidence interval of this quotient was smaller than the symbol size at all voltages except −50 mV. The ratio is undefined at the reversal potential of 0 mV. (E) Plot of the inverse time constant of block at the indicated potentials as a function of the free Mg concentration. Data for low and high concentrations of Mg are mean ± SEM of eight and four recordings acquired and analyzed as described in A–D. (F) Kinetic parameters of Mg block plotted as a function of the test potential. Parameters were determined from τblock (such as shown for 1 mM Mg in B and F1) and the steady-state current inhibition (D) according to Eqs. 1–3 based on the zero time extrapolation of the block exponential (upright open triangle) or the instantaneous current predicted from scaled amplitudes determined in the absence of internal Mg (inverted open triangle) and from 1/τBLOCK versus free Mg concentration (E) (upright filled triangles). Solid blue lines are regressions to the data represented by the inverted open triangles. The dashed blue line represents the predicted value of kOFF based on δOFF = 0.17 (from δ-δON where δ and δON are 0.36 and 0.19, respectively) and kOFF 0 = 1848 s−1 (from the 0 mV version of Eq. 3 where kon 0 = 7.97 × 10⁵ M−1s−1 and KA 0 = 431 M−1). The inset in F1 shows relationship of τBLOCK to membrane voltage at 0.924 mM free Mg when kOFF 0 and δOFF are 1848 s−1 and 0.17 (thick line) or 936 s−1 and 0.03 (thin line). The ordinates are logarithmic in the main panels but linear in the inset.

