Figure 3.
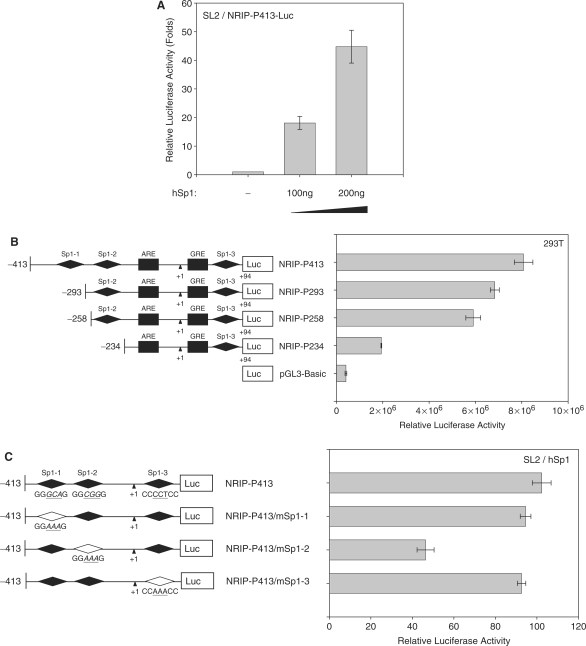
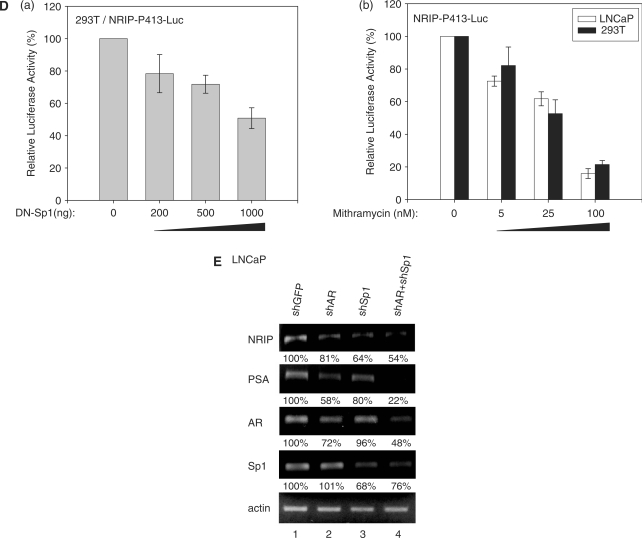
Sp1 regulation on NRIP promoter. (A) Sp1 activation of the NRIP promoter in Drosophila SL2 cells, which lacks endogenous Sp1. Sp1-negative SL2 cells were transfected with NRIP-P413 and increasing amounts of Sp1-expression plasmid (pPac-hSp1). The promoter activity of Sp1 was measured as described above. The fold change was measured by the luciferase activity of each experimental condition compared to that of the absence of the expression of Sp1. (B) NRIP promoter activity measured by a series of Sp1-binding site deletion mutants in 293T cells. A series of 5′-end NRIP-promoter deletion mutants were constructed and named NRIP-P283, NRIP-P256 and NRIP-P234. These lacked Sp1-1, Sp1-1/Sp1-2 and Sp1-1/Sp1-2-binding sites, respectively. Luciferase activities were measured in 293T cells as described in Figure 1B. (C) Sp1 influences the Sp1-2 site of the NRIP promoter. Site-directed mutagenesis at three Sp1-binding sites was generated from the NRIP-P413 promoter and named NRIP-P413/mSp1-1, NRIP-P413/mSp1-2 and NRIP-P413/mSp1-3, respectively. The point mutant sequences were underlined shown in left panel. These three Sp1 site-mutant promoters and pPac-hSp1 were transfected into Sp1-negative SL2 cells. (D) Dominant-negative Sp1 mutant inhibits NRIP promoter activity. Panel a: 293T cells were cotransfected with 0.5 μg of NRIP-P413 and the various doses of the dominant-negative Sp1 expression vector (pEBG DN-Sp1), and the total amount of plasmids was adjusted with empty pEBG vector. The reporter luciferase activity was measured as described above and normalized to the activity of pRL-TK. Panel b: Mithramycin A inhibits NRIP promoter activity. NRIP-P413 was transfected into either LNCaP or 293T cells, 24 h later, cells were incubated with the various concentrations of mithramycine A for another 24 h. Relative NRIP promoter activities (%) were counted as 100% in the cells without treatment of mithramycin A. Data are mean ± SD from three independent experiments. (E) AR and Sp1 cooperative regulation of NRIP transcription. LNCaP cells were infected with lentivirus encoding shRNA to AR and Sp1 individually or in combination; lentivirus-carrying shGFP was a control. Three days post-infection, total RNA was extracted and 5 µg of RNA was amplified by semi-quantitative RT-PCR using NRIP, PSA, AR, Sp1 and β-actin primers. One representative data set from three independent experiments is shown. The expression level of NRIP RNA quantified by UVP imaging was normalized to β-actin.


