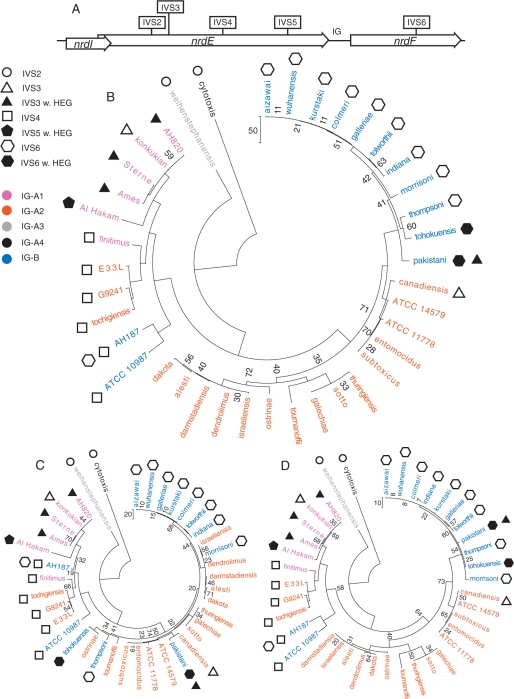
Figure 6.
The nrdEF genes in the B. cereus group. (A) Gene map showing the positioning of the genes and IG-sequence within the operon and the IVS insertion points in the operon. Phylogenetic trees based on the sequence of the (B) nrdIEF operon, (C) nrdE-coding sequences and (D) nrdF-coding sequences from 39 strains of the B. cereus group. Symbols represent the presence of IVS in the strain where filled and empty symbols represent a group I intron with and without HEG, respectively. Colours represent the IG-sequence groups each strain belongs to. The distance bars represent the number of nucleotide changes in the sequence alignments. Only bootstrap values below 75% are shown.

