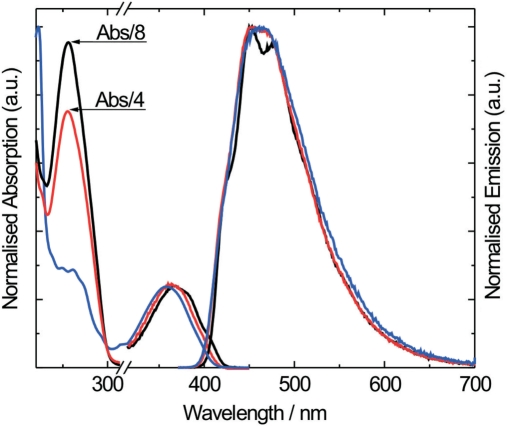
Figure 2.
Isotropic absorption and emission spectra of the tCO nucleoside (blue), tCO-containing single strand (AA, red) and tCO-containing double strand (AA, black). The spectra have been normalized at the maxima of the lowest energy absorption band (left) and of the emission (right), respectively.

