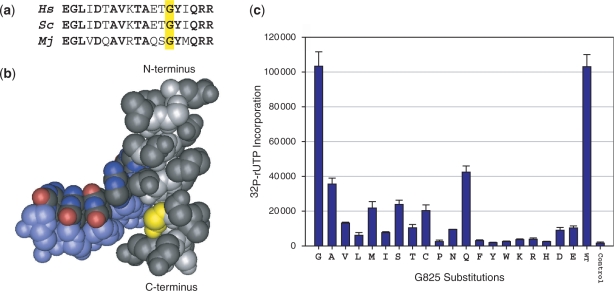
Figure 4.
Saturation mutagenesis of mjA′-G825. (a) The sequence alignment shows part of the central and C-terminal region of the Bridge Helix [Hs, Homo sapiens RPB1 (positions 845–863); Sc, Saccharomyces cerevisae RPB1 (positions 822–840); Mj, M. jannaschii A′ (positions 812–830)]. Bold residues are identical in all three species and the residues orthologous to mjA′-G825 are marked by an yellow box. (b) The position of the glycine residue in yeast RNAPII corresponding to mjA′-G825 is shown in yellow. The Bridge Helix (including the residues aligned in a) is in gray and the backbone of the DNA template strand is shown in light blue. Note the close spatial proximity between the G825 side chain and the phosphodiester backbone of the DNA [data from PDB #1SFO (5) visualized with Cn3D; www.ncbi.nlm.nih.gov/Structure/CN3D/cn3d.shtml]. (c) Transcription activity assays of RNAP variants containing all 19 possible substitutions of mjA′-G825 carried by the RNA polymerase factory. The two columns on the right represent the positive (WT; wild-type) and negative (RNAP containing a mjA′-T821 termination codon substitution) control reactions. Error bars shown represent standard deviations (n = 4) based on independently expressed, assembled and assayed mutants carried out in parallel.

