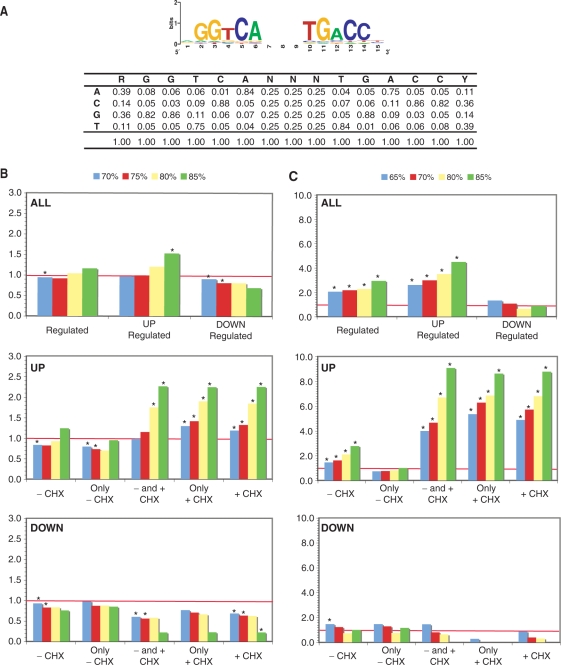
Figure 6.
Estrogen response elements are enriched in the vicinity of primary up-regulated genes. (A) Position weight matrix used for identification of putative EREs in the vicinity of target genes. The frequency of nucleotides at each position of the ERE in the matrix is shown. (B) The ratios of the number of EREs per gene in 20 kb windows (±10 kb) around the transcriptional start sites of regulated genes to the number of EREs per gene in the same windows of all annotated genes in the human genome are shown for various groups of estrogen target genes. (C) The ratios of EREs found in ERα-bound chromatin regions (Ref. 50) located within a 20 kb window of the regulated genes identified in our study over EREs found in ERα-bound chromatin regions at ±10 kb of all genes in the genome are shown for various groups of estrogen target genes. ChIP regions were standardized to 1 kb on either side of the center of the region for this analysis. The numbers of genes in each category analyzed in B and C are indicated in Materials and Methods section.

