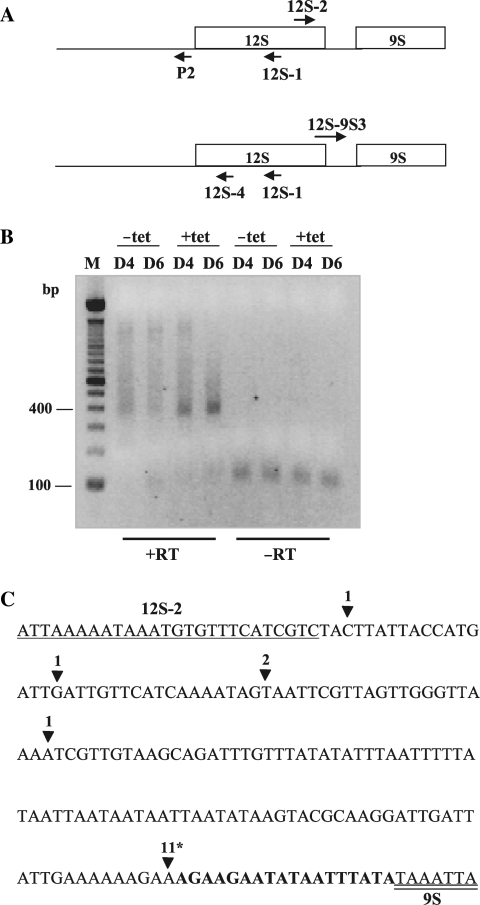
Figure 5.
Characterization of 5′ extended 12S rRNA precursors in TbDSS-1 RNAi cells. (A) Location of primers P2, 12S-1 and 12S-2 (top) and 12S-4, 12S-1 and 12S–9S3 (bottom) used to map the 5′ and 3′ extremities of unprocessed 12S rRNA in TbDSS-1 RNAi cells by cRT-PCR. Arrows indicate the orientations of the primers. (B) Negative image of an ethidium bromide-stained agarose gel of cRT-PCR products amplified from 12S-1 primed cDNA using primer P2 in combination with 12S-2. M, DNA marker consisting of bands with 100 bp increments. The position of the 100 and 400 bp markers are indicated on the left. (C) Schematic of experimentally determined 3′ extremities of 12S rRNA sequences in induced, solid arrowhead, samples on Day 4 after tetracycline addition. The sequences of primer 12S-2 and the 5′ end of 9S rRNA are underlined and double underlined, respectively. The 12S–9S intergenic region is shown in bold. The number of clones obtained with the respective 3′ end is indicated above each arrowhead. An asterisk indicates the positions of oligo(U) tails of 6–19 nt.

