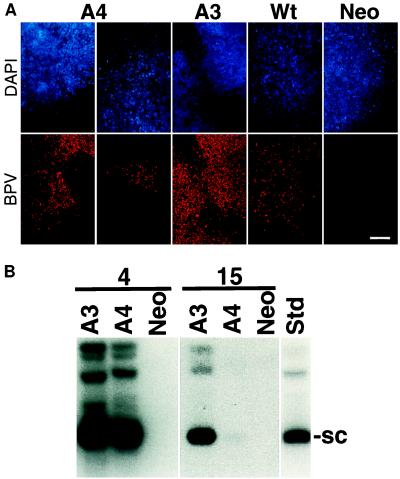
Figure 2.
Loss of viral DNA from dividing cells. (A) FISH analysis of colonies of cells cotransfected with BPV DNA and the neomycin-resistance gene. After drug killing of nontransfected cells and growth of colonies for 2 weeks, BPV DNA was detected by the red precipitate and cellular DNA was detected by blue DAPI staining. Wild-type (Wt) and A3 DNAs were detected in nearly all surviving cells. The A3 example shows the edge of two neighboring colonies, all of the rest are from individual colonies. The neor control shows that colonies obtained by single transfection of the drug marker do not give a signal with the BPV probe. A4 DNA was observed in a subset of cells in a range from a few to all within the colony. These examples show sectoring of the colonies. (Bar = 100 μm.) (B) Loss of A4 DNA requires cell division. Cells were transfected, drug-selected, and grown for the same time as in A but were plated under two different conditions. In lanes labeled 4, the cells were plated densely allowing only about four doublings before contact inhibition of further growth. In lanes labeled 15, the cells were plated sparsely and split every 3 days to facilitate logarithmic-phase growth (about 15 doublings). Low molecular weight DNA was isolated from equivalent numbers of cells for each lane and uncut DNA was examined by Southern blotting with random-primed BPV DNA as probe.

