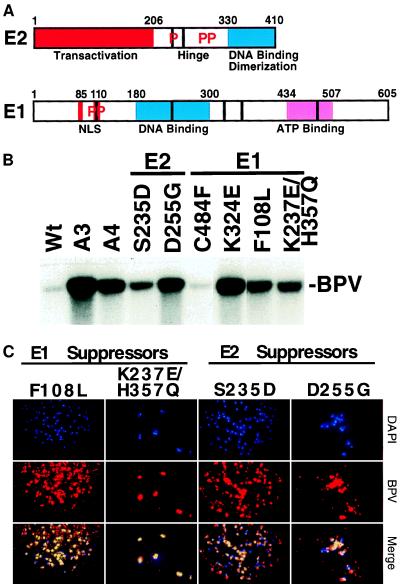
Figure 4.
Behavior of suppressors in replication and chromosomal localization assays. (A) Graphical representation of the functional domains of E1 and E2 proteins with the suppressor mutations indicated as vertical bars. The positions of known phosphorylated Ser residues in E2 (11, 13) or Ser and Thr residues in E1 (14, 15) are indicated by Ps. (B) One microgram of the genomes containing the indicated mutation was transfected into C127 cells, low molecular weight DNA was harvested at day 6 and examined by Southern blotting using random-primed BPV as probe. The position of EcoRI-linearized, DpnI-resistant full-length BPV is indicated. (C) Suppressors restored metaphase chromosomal localization of the BPV DNA. FISH analysis was performed as in Fig. 3.

