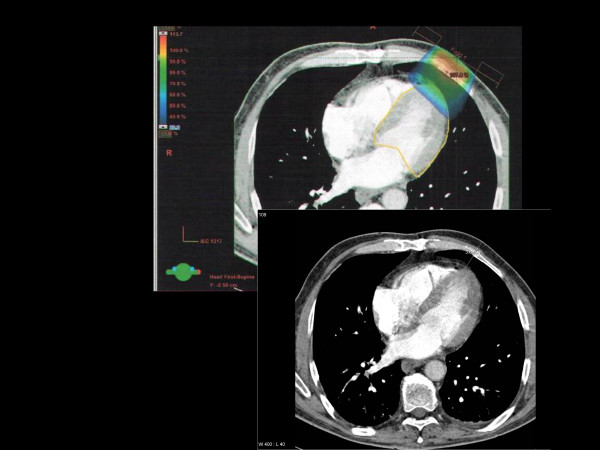
Figure 3.
Axial contrast-enhanced computed tomography scan 3 cm caudal from the mamilla displaying on the lower image the approximate depth of the 50% isodose from a standard 9 MeV electron beam (6 MeV would have been appropriate). 3-D planning illustrates that the actual dose to the heart is even higher. The left ventricle (contoured in yellow) is the part of the heart that receives the highest dose (maximum 80%). The blue isodose wash refers to 33% of the prescription dose, i.e. 5 Gy.

