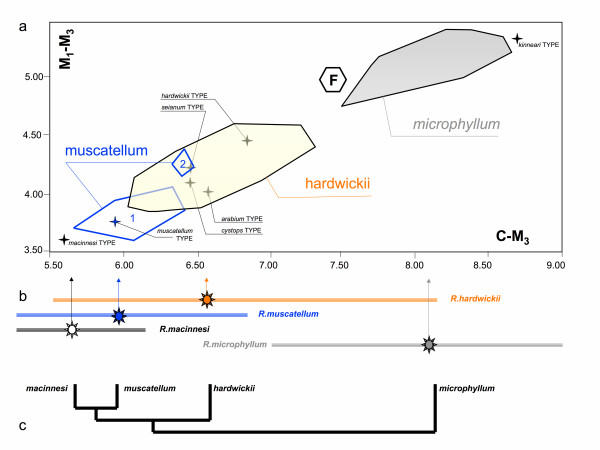
Figure 2.
Morphometric characteristics of Rhinopomatidae. a – scatter plot of CM3 vs. M1–M3 in the sample examined in frame of this study (n = 252, for further data see [28, 29]) with position of the respective type specimens: note metric distinctness of the phenotypic forms hardwickii, microphyllum, muscatellum (1 – Iran, 2 – Yemen) and position of the Miocene fossil from Elaiochoria 2, Greece; b – mean values and variation span of CM3 in four species of Rhinopoma as reported by Van Cakenberghe and De Vree [9], n = 357, 63, 54, 154; c – phylogenetic hypothesis suggested by morphometric characters.

