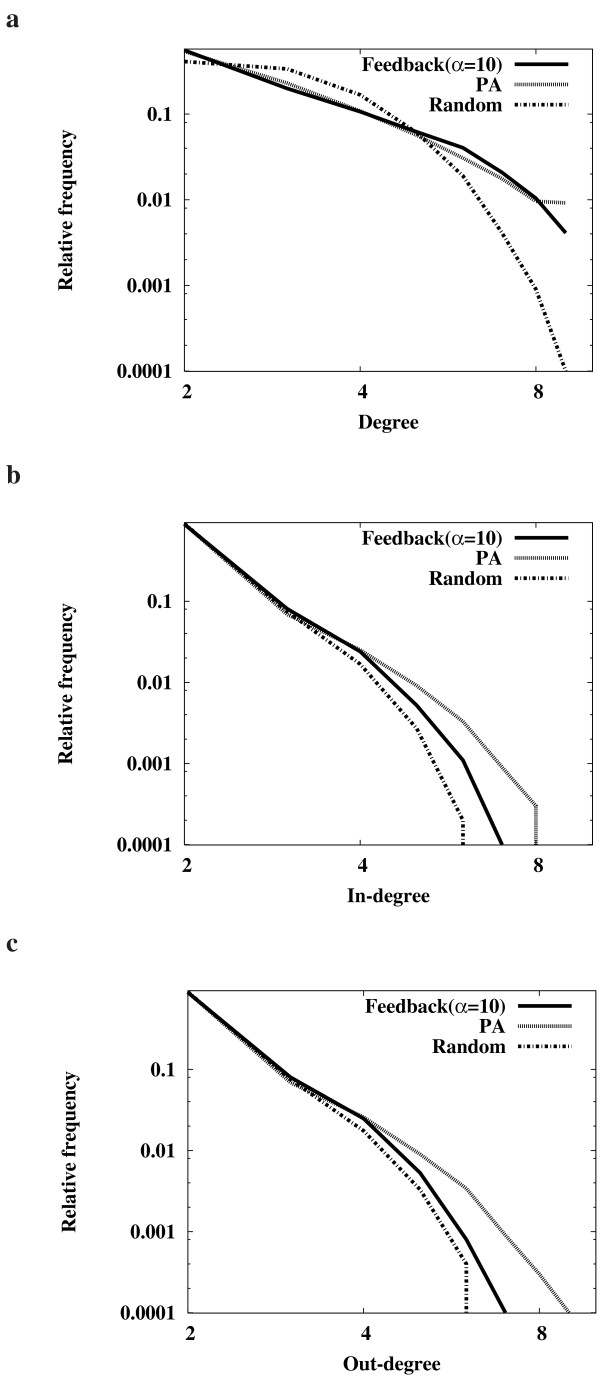
Figure 3.
Degree distributions of the evolved networks. (a) Total degree distributions. (b) In-degree distributions. (c) Out-degree distributions. All distributions were examined over 1,000 different networks that were evolved using the "PA" and "Feedback"(α = 10) models until |V| = 46. In addition, the "Random" networks were examined. The networks evolved by the "Feedback" model with other selection pressure values also showed similar degree distributions (see additional data file 3).

