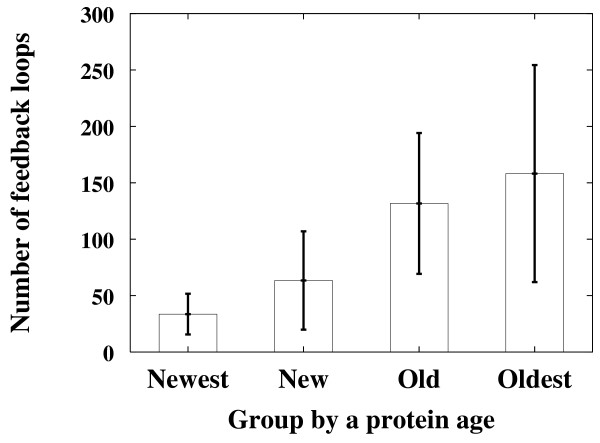
Figure 4.
The correlation between the number of feedback loops and the protein age of the neuronal signaling network. The number of feedback loops are plotted against the age of the proteins. The proteins are grouped into four categories according to their estimated ages: "Newest", "New", "Old", and "Oldest" (see Methods for details). For each protein group, the average and the confidence level (95%) of the NuFBL are shown on the y-axis.

