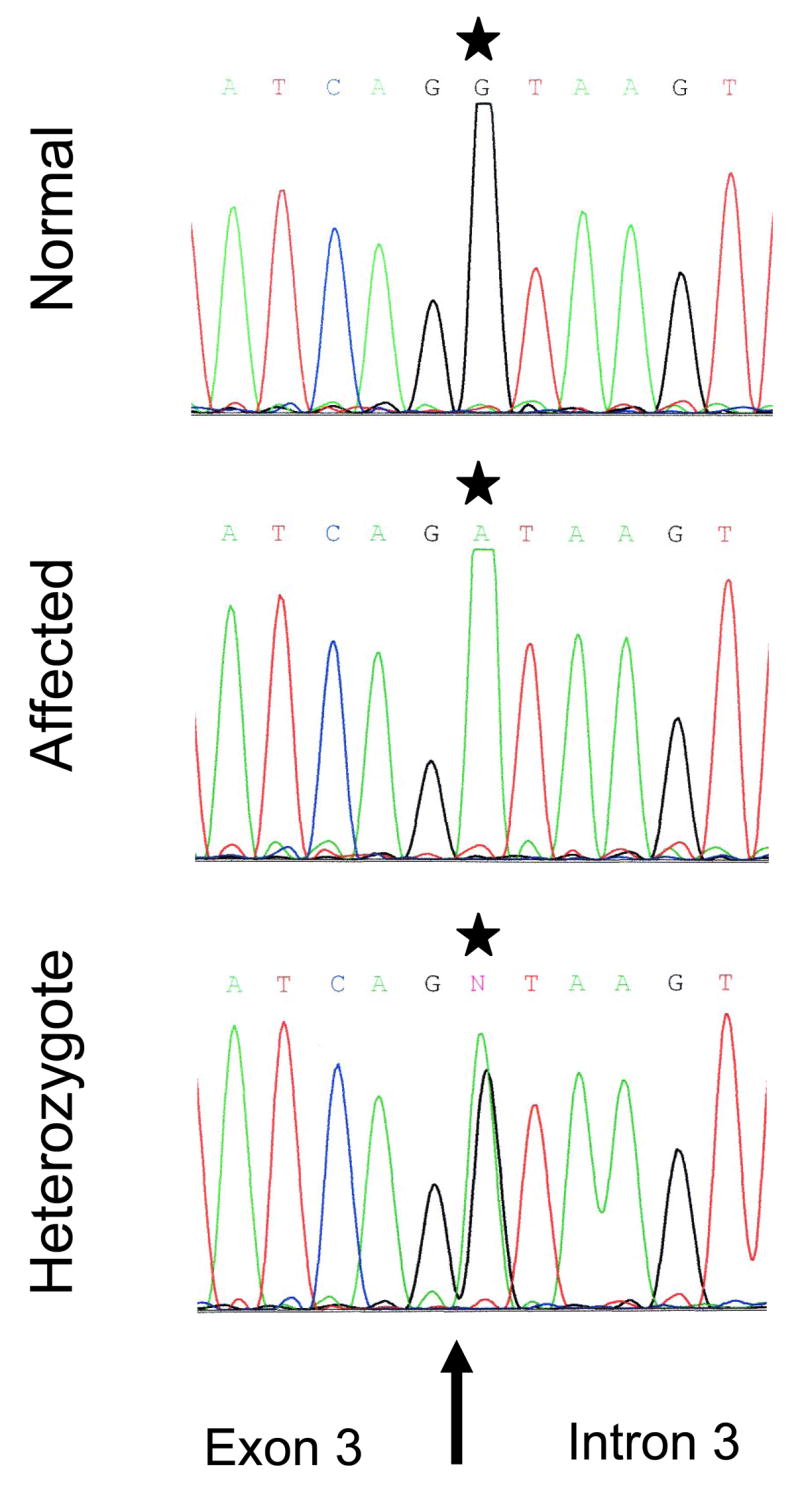
Fig. 2. Electropherograms of a normal (top panel), an affected (middle panel) and a heterozygote Borderdale sheep (bottom panel).

The affected sheep chromatograph shows the substitution c.571+1G>A (*). Note the presence of both alleles in the heterozygote animal. The arrow indicates the exon 3/intron 3 boundary.
