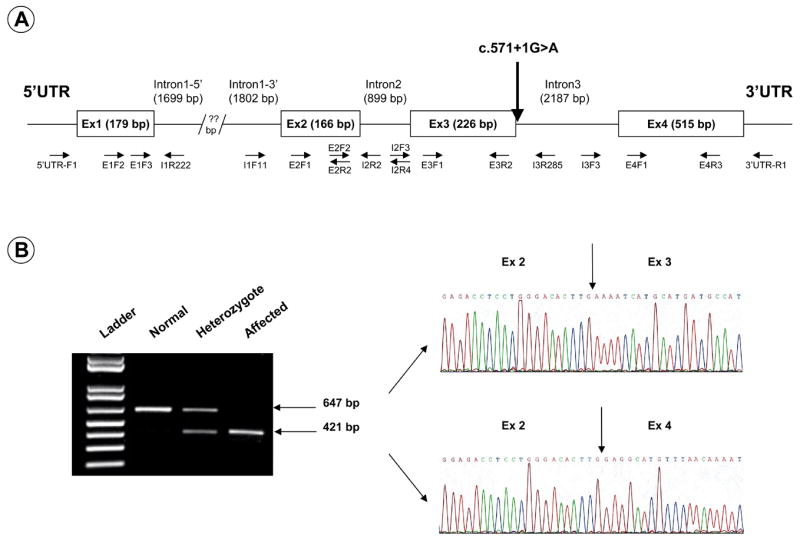
Fig. 3.

(A) Map of ovine CLN5. Note the position of the mutation observed in the Borderdale sheep (c.571+1G>A) as well as the position of the primers used in the sequencing of the gene. (B) CLN5 splice variant. (Left panel) Reverse transcription-PCR amplification of CLN5 between exons 2 and 4 yield normal transcripts retaining exon 3 on an agarose gel (647 bp) or affected transcripts lacking exon 3 (421 bp). Heterozygote transcripts contain both bands. (Right panel) Sequencing of the two bands confirmed the exact lack of exon 3 in the smaller band. Arrows indicate the boundaries of each exon.
