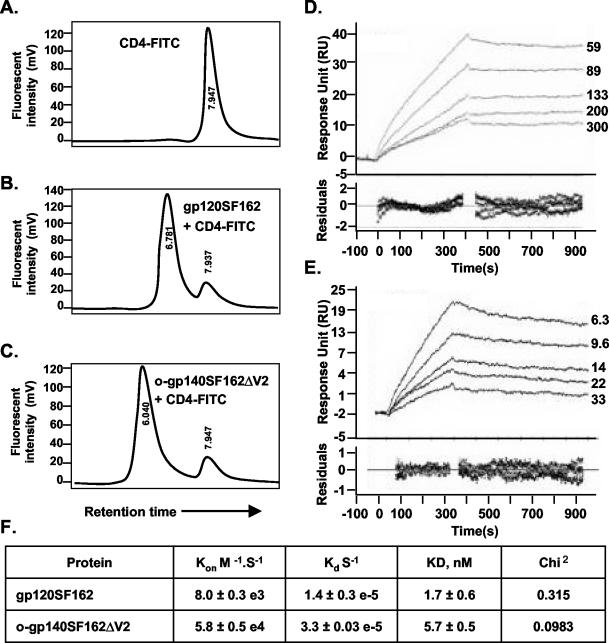
FIG. 6.
(A to C) Shown is binding of purified gp120SF162 (B) and o-gp140SF162ΔV2 (C) to CD4, as determined by an HPLC-based assay, and an unbound CD4 profile (A). (D and E) Shown is the kinetics analysis of gp120SF162 (D) and o-gp140SF162ΔV2 (E) binding to immobilized sCD4. Different sensograms in panels D and E were generated by using a range of concentrations of gp120SF162 (59 to 300 nM) (D) and o-gp140SF162ΔV2 (6.3 to 33 nM) (E). Sensor data were prepared for kinetic analysis by subtracting binding responses collected from a blank reference surface. The association and dissociation phase data were fitted simultaneously to a single-site binding model by using Biaevaluation 3.2. (F) Summary of the kinetic data.

