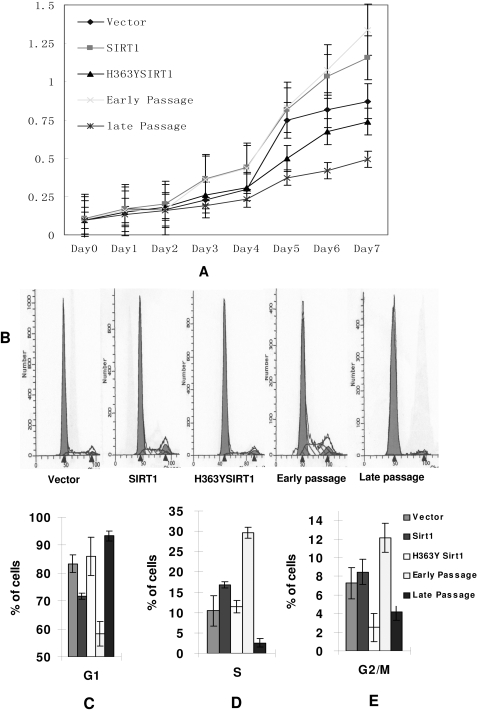
Figure 2. Induced expression of SIRT1 promoted cell proliferation in 2BS cells.
(A) Growth curves of transfected 2BS cells (all at PD50) with expression of Vector, SIRT1, and H353YSIRT1. Early passage (23PDs) and late passage cells (58PDs) of 2BS were shown for comparison. Cell proliferation was determined by the MTT assay. Each experiment was performed on 6 independent wells at each time indicated. (B) Flow cytometric analysis of 2BS cells with expression of empty vector, SIRT1 and H363YSIRT1. Early passage (23 PDs) and late passage 2BS cells (58 PDs) were also shown for comparison. Experiments were repeated 3∼4 times with similar results. (C, D, E) Typical cell cycle histograms representing percentage of cells at G1, S, G2/M phases were recorded from 3 replicate experiments. The mean percentage of cells at different phases was showed below.

