FIG. 2.
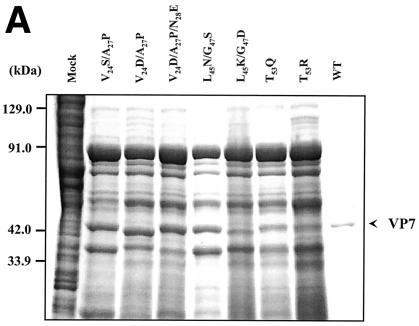
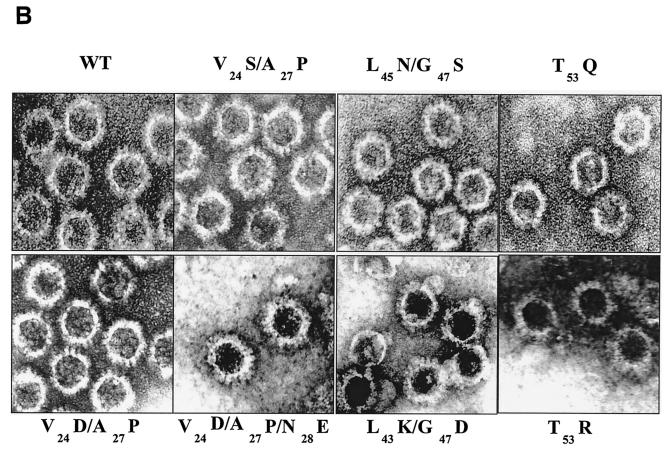
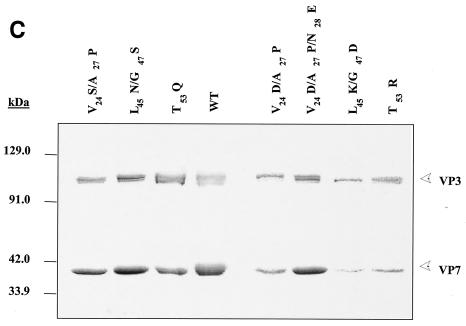
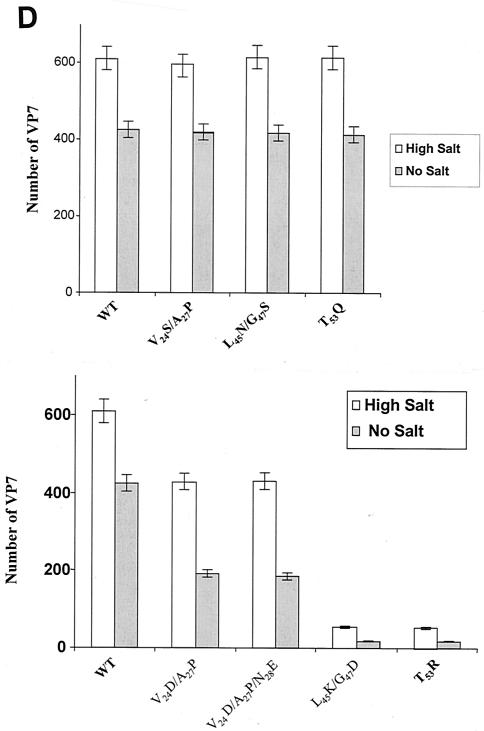
Analysis of VP7 class I and class II mutant protein interaction with BTV VP3 protein. Sf9 cells were coinfected with recombinant baculoviruses expressing BTV VP3 and either wild-type VP7 (WT) or various VP7 mutants (V24S/A27P, L45N/G47S, T53Q, V24D/A27P/N28E, V24D/A27P, L45K/G47D, and T53R, as indicated). The resulting CLPs were purified on CsC1 gradients and then analyzed. (A) Analysis of infected cell lysates by SDS-10% PAGE, followed by Coomassie blue staining. Note that VP3 is occasionally visualized as a doublet due to cleavage by resident protease of Sf9 cells. (B) EM images of CLPs formed by wtVP3+wtVP7 or wtVP3 with differ ent mutant VP7s (upper panel, class I; lower panel, class II) as indicated. (C) CLPs were analyzed by SDS-PAGE and stained with Coomassie brilliant blue. The positions of VP3 and VP7 are indicated. The CLP identity is indicated above each lane. (D) Number of VP7 molecules per CLP. Sucrose gradient (for low salt)- or CsCl gradient-purified CLPs were resolved by SDS-PAGE, and the image of the gel was captured and analyzed by using AlphaImager 2000 v.3.2 software (Alpha Innotech Co.). The number of VP7 molecules per CLP was calculated by determining the ratio of the density of VP7 to VP3, with VP3 as the denominator. The data shown are representative of three experiments, the value of which varied by no more than 10%. The number of VP7 molecules per CLP is listed under the conditions indicated.


