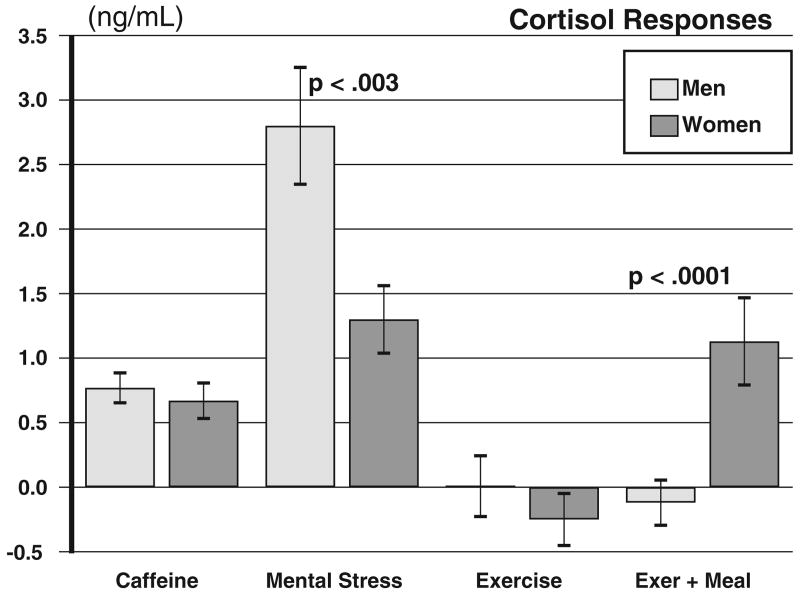
Fig. 2.
Mean changes in cortisol levels for men and women. Bars labeled Caffeine show difference between placebo and caffeine averaged over all time points starting at 60 min after first caffeine dose in the morning. Bars labelled Mental Stress, Exercise, and Meal indicate changes in cortisol from the value preceding the manipulation to immediately afterward, averaged over placebo and caffeine days. Bars for Meal reflect only the meal eaten after exercise. Significance values reflect Sex by Period interaction terms.

