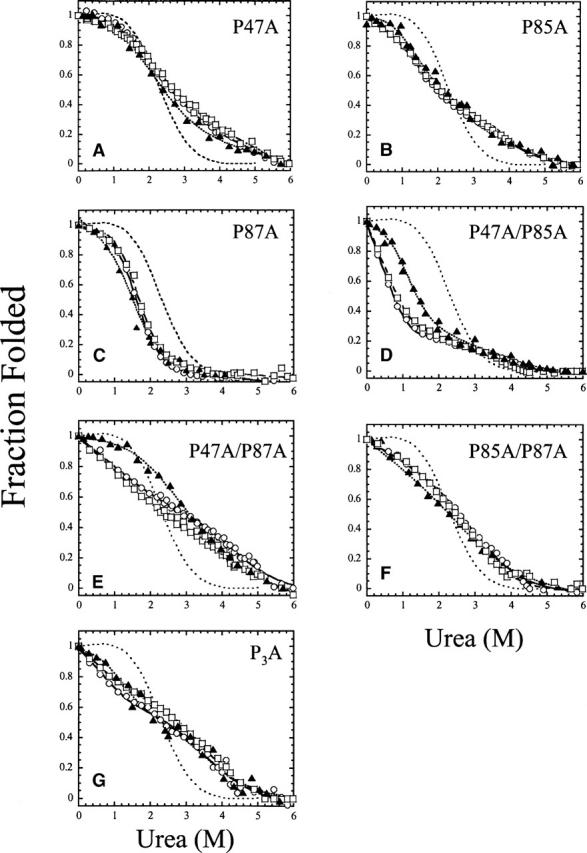
Figure 3.

Equilibrium unfolding of the proline mutants of RICK-CARD. The fluorescence emission (excitation at 280 [○] or 295 nm [□]) and CD (220 nm; ▴) are plotted versus urea concentration. The data were fit globally as described in Materials and Methods, and the results of the fits are shown as the solid line (fluorescence emission, excitation 280 nm), dashed line (fluorescence emission, excitation 295 nm), or dotted line (CD, 220 nm). The intermediate dashed line in each panel represents wild-type RICK-CARD, as described previously (Chen and Clark 2003). Parameters obtained from the global fits are described in the text. (A) P47A, (B) P85A, (C) P87A, (D) P47A/P85A, (E) P47A/P87A, (F) P85A/P87A, and (G) P3A.
