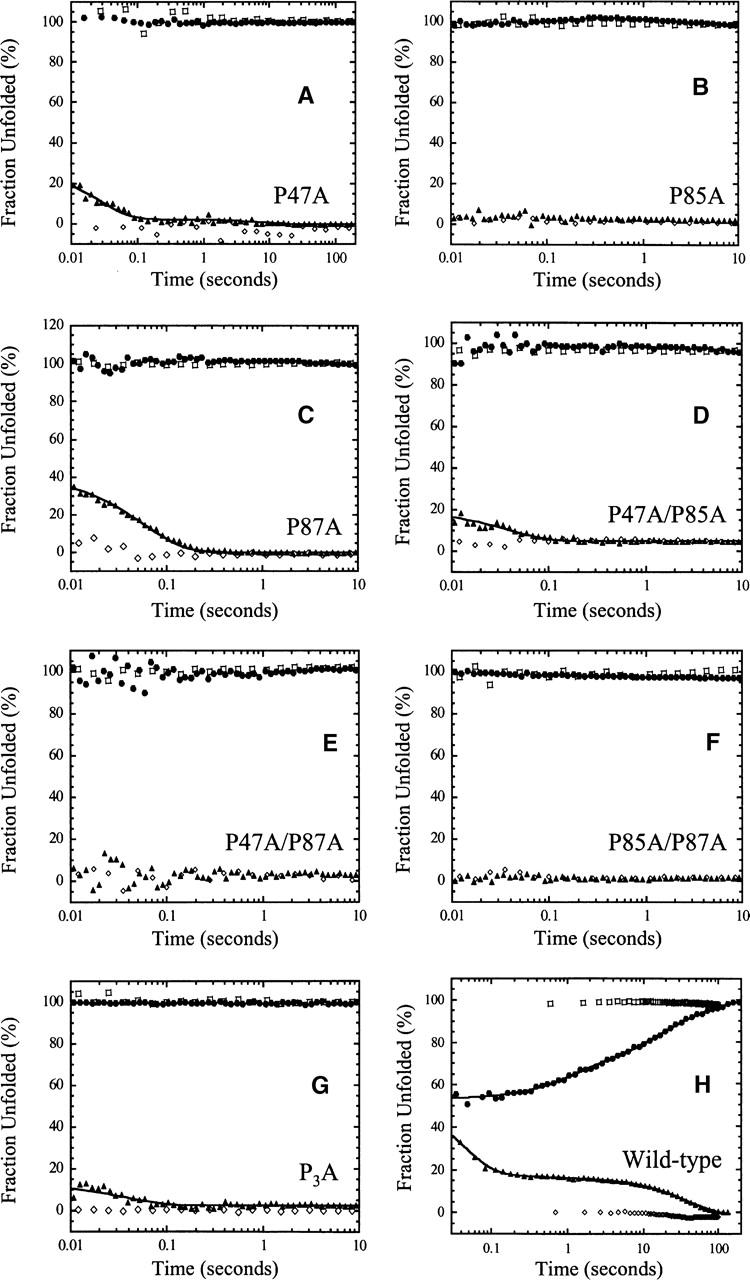
Figure 4.

Single mixing stopped-flow refolding and unfolding traces of (A) P47A, (B) P85A, (C) P87A, (D) P47A/P85A, (E) P47A/P87A, (F) P85A/P87A, (G) P3A, and (H) wild-type RICK-CARD. In all panels, the native control (⋄) and the unfolded control (□) are shown. For each protein, the unfolding traces are shown as solid circles (•), and the refolding traces are shown as solid triangles (▴). The solid lines represent fits to a sum of exponentials, as described in the text. Results from the fits are shown in Table 1.
