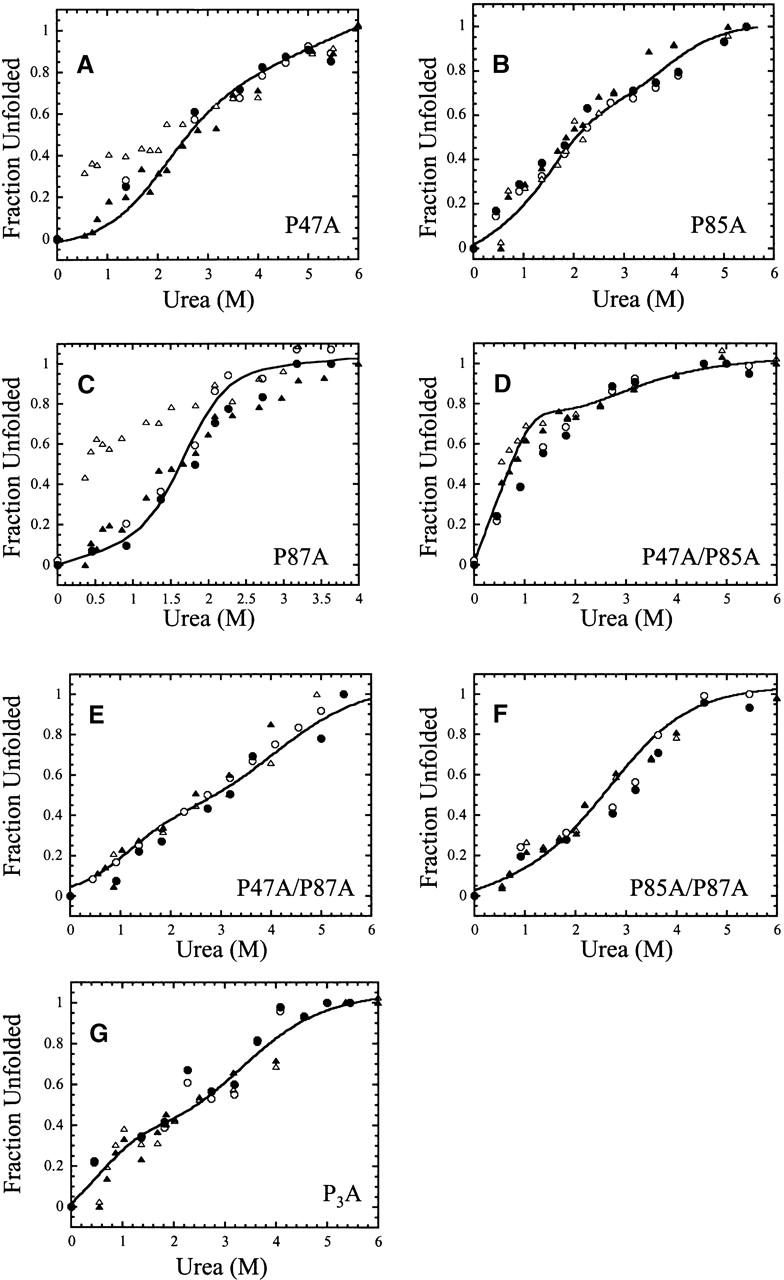
Figure 5.

Signals of unfolding and of refolding versus final urea concentration: (A) P47A, (B) P85A, (C) P87A, (D) P47A/P85A, (E) P47A/P87A, (F) P85A/P87A, and (G) P3A. The initial signals (10 msec) of unfolding (○) and of refolding (▵) and the final signals (10 sec) of unfolding (•) and of refolding (▴) are plotted. The solid lines represent fits of the equilibrium unfolding data shown in Figure 3.
