
Figure 7.
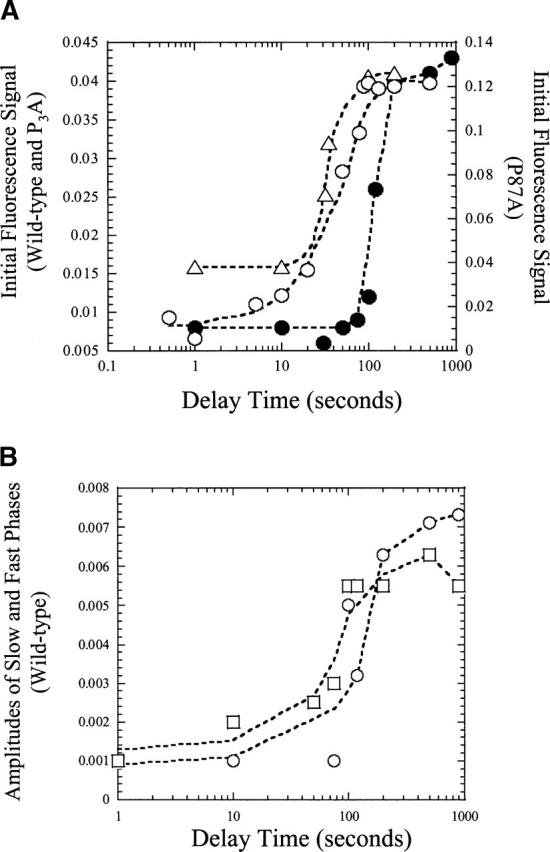
Interrupted refolding studies. (A) Fluorescence signal versus delay time for wild-type (•), P3A (▵), and P87A (○) RICK-CARDs. (B) Amplitudes of fast (○) and slow (□) phases versus delay time for wild-type RICK-CARD. The lines through the data are of no theoretical value, and are presented to guide the eye.