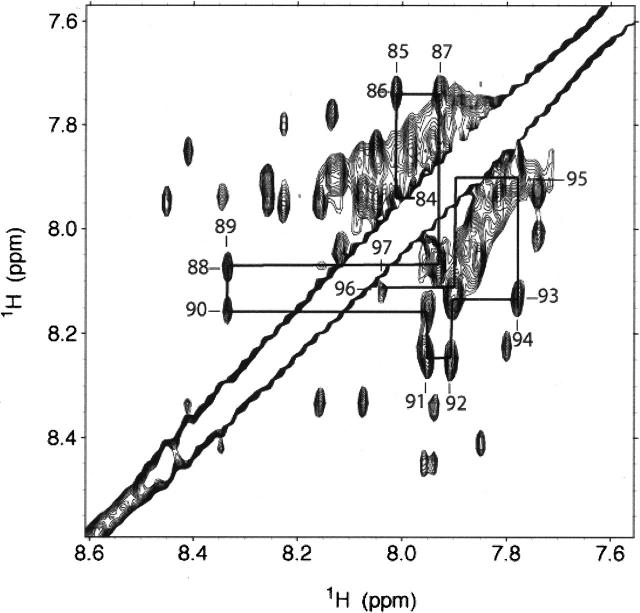
Figure 2.
NMR analysis of CSD. This downfield section of a CSD NOESY map (τ m = 400 msec; 20° C, 33% d-TFE, 25 mM d-sodium acetate) shows cross-peaks between back bone amide protons that are consistent with α-helical secondary structure. The major species was found to populate a helical conformation between residues Ile84CSD and Tyr97CSD.

