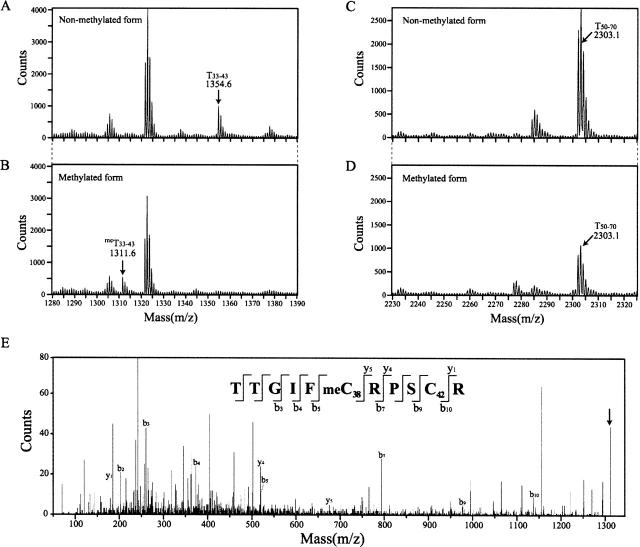
Figure 2.
An expanded view of MALDI-TOF mass spectra of the iodoacetamide-treated tryptic fragments of the nonmethylated and the methylated forms of N-Ada16k. (A) The peak at m/z 1354.6 of the nonmethylated form corresponds to the expected mass (1354.6360 Da) of the T33–43 peptide containing Cys38 and Cys42, which follows the carboxyamidomethylations of two cysteine residues with the carboxyamidomethyl group substitution of the cysteine γ-thiol hydrogen. (B) The peak at m/z 1311.6 of the methylated form corresponds to the expected mass (1311.630 Da) of the meT33–43 peptide, which follows the carboxy-amidomethylation of one cysteine residue and the methylation of the other. (C, D) Each of peaks at m/z 2303.1 corresponds to the expected mass (2302.0927 Da) of the T50–70 peptide containing Cys69 with the carboxyamidomethylation. (E) MS/MS spectrum of the meT33–43 peptide. An arrow indicates a mono-charged parent ion (m/z 1311.6 Da). The matched y-type and b-type fragment ions are displayed. The peptide sequence was identified to TTGIFmeC38RPSC42R, where meC represents Sγ-methyl cysteine.

