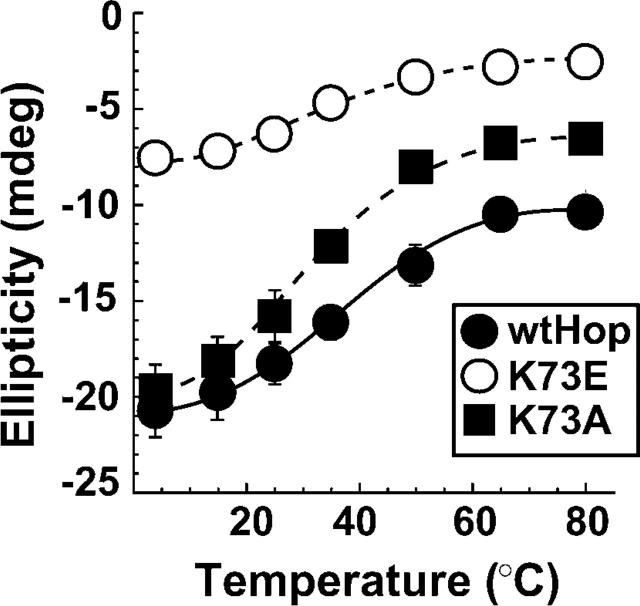
Figure 2.
Structural stability differs with TPR1 point mutations. Far UV-CD measurements were made for equivalent concentrations of wtHop (solid circles), K73E (open circles), and K73A (solid square) at pH 3 over a range of temperatures. The values plotted are the average (n = 3) measured ellipticity (in millidegrees) at the 222 nm peak vs. temperature for each of the Hop forms. Similar patterns were obtained if ellipticity was taken from the 210 nm peak.

