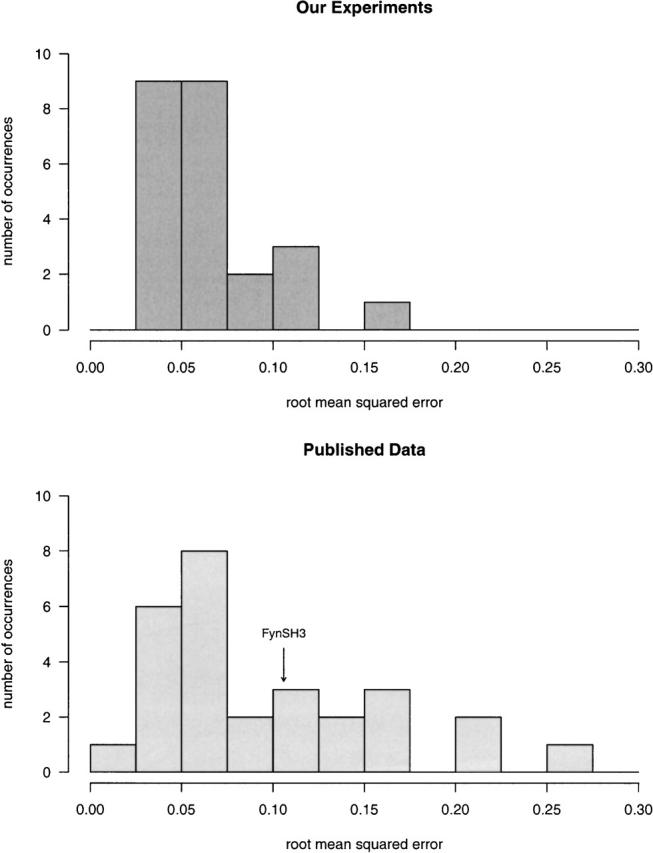
Figure 2.

The precision of the kinetic measurements described here compares favorably with many previously reported in the literature. For example, the mean, the median, and the maximum root mean squared residuals associated with the 24 chevron curves we have determined (triplicate measurements of each of eight sequence, upper panel) are less than those of a set of 28 previously reported chevron curves determined in 16 different laboratories (lower panel) (Maxwell et al. 2005). Indicated is the precision with which the FynSH3 wild-type folding rate is defined by the previously reported data.
