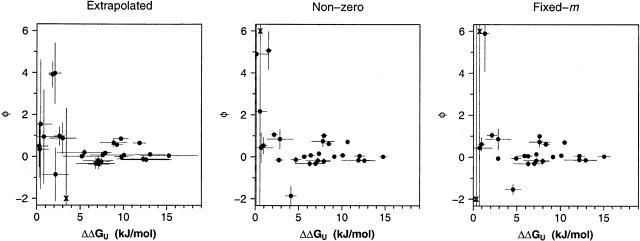
Figure 4.
Shown here are the average ΔΔGu values and average φ-values obtained from independent measurements across three laboratories. The horizontal and the vertical bars present the standard deviations of the respective measurements. As indicated by the rapid increase in the size of the error bars on the left-hand sides of these plots, we find that the precision with which we can measure φ is reasonable when the estimated ΔΔGU is high but becomes quite poor at lower ΔΔGU. At larger ΔΔGU the precision of estimates of φ is significantly improved when we employ the nonzero and fixed-m analysis methods, an observation that also holds for estimates of ΔΔGU. Several data points are simply indicated with the symbol “x” at the top of the plot for clarity.

