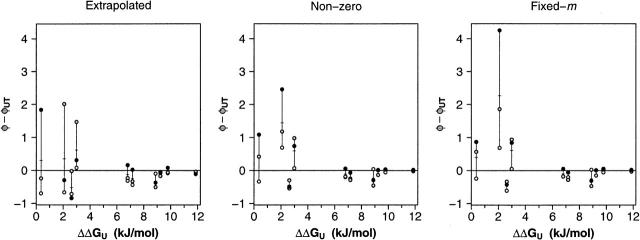
Figure 6.
When ΔΔGU is large, φ-values derived independently in each of our groups closely approach those calculated using previously reported data from an independent laboratory (φUT) (Northey et al. 2002). In contrast, rather large deviations are observed when ΔΔGU is smaller. The crossed bars indicate the mean of the values reported here. Otherwise, the symbol scheme is as described above (Fig. 1).

