
Figure 7.
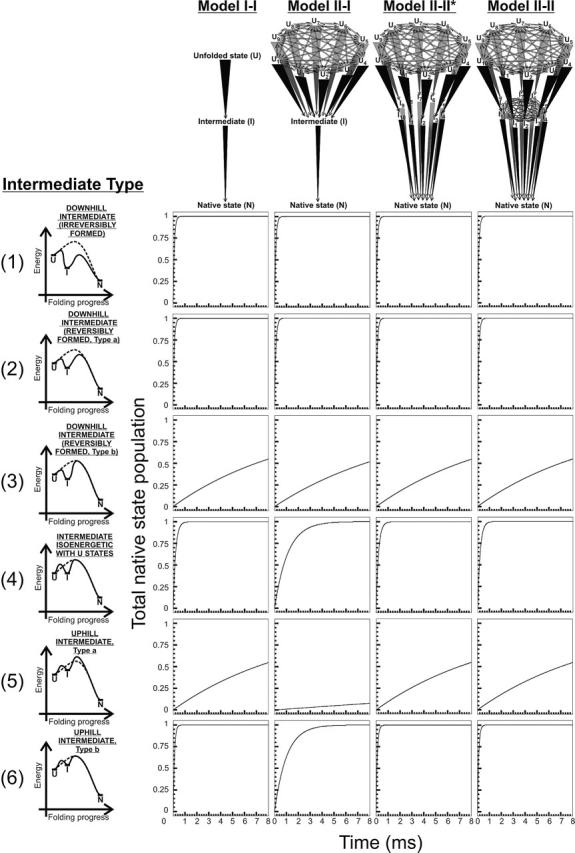
Expected time courses for native state formation according to the kinetic models illustrated in the upper portion of the figure. Each model involves at least one folding intermediate. Specific kinetic parameters are reported in Table 2. The step(s) connecting unfolded and intermediate state(s) are reversible, for intermediates of types 2 to 6. Unfolded state and intermediate interconversion rates were set to kinter-U = kinter-I = 1010 sec−1. The graphs on the left side of the figure illustrate the folding progress through the fastest path for each kinetic model. The different kinetic models are named according to the general models of Figure 1, for the U to I, and I to N steps, respectively. The asterisks refer to modified model types characterized by non–mutually interconverting intermediates.