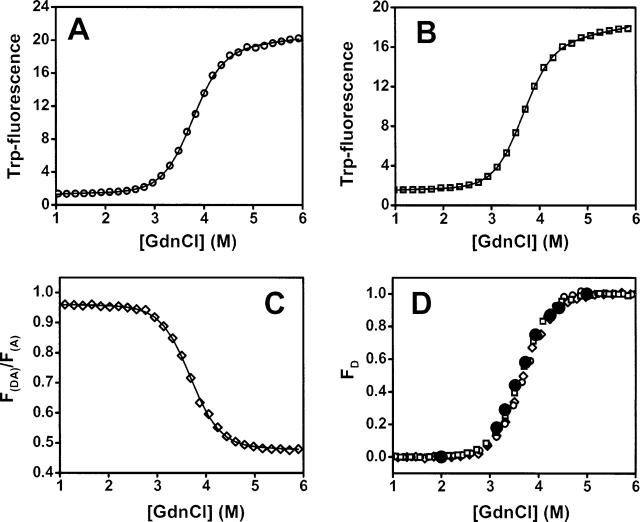
Figure 3.
Equilibrium denaturation curves of (A) CI2-C40, (B) TG-CI2-C40, and (C) (A647) TG-CI2-(A488)C40 (measured by ensemble FRET). (D) Normalized curves are shown in A–C (same symbols used). The black-filled dots are data obtained from fitting the single-molecule FRET histograms shown in Figure 2E.

