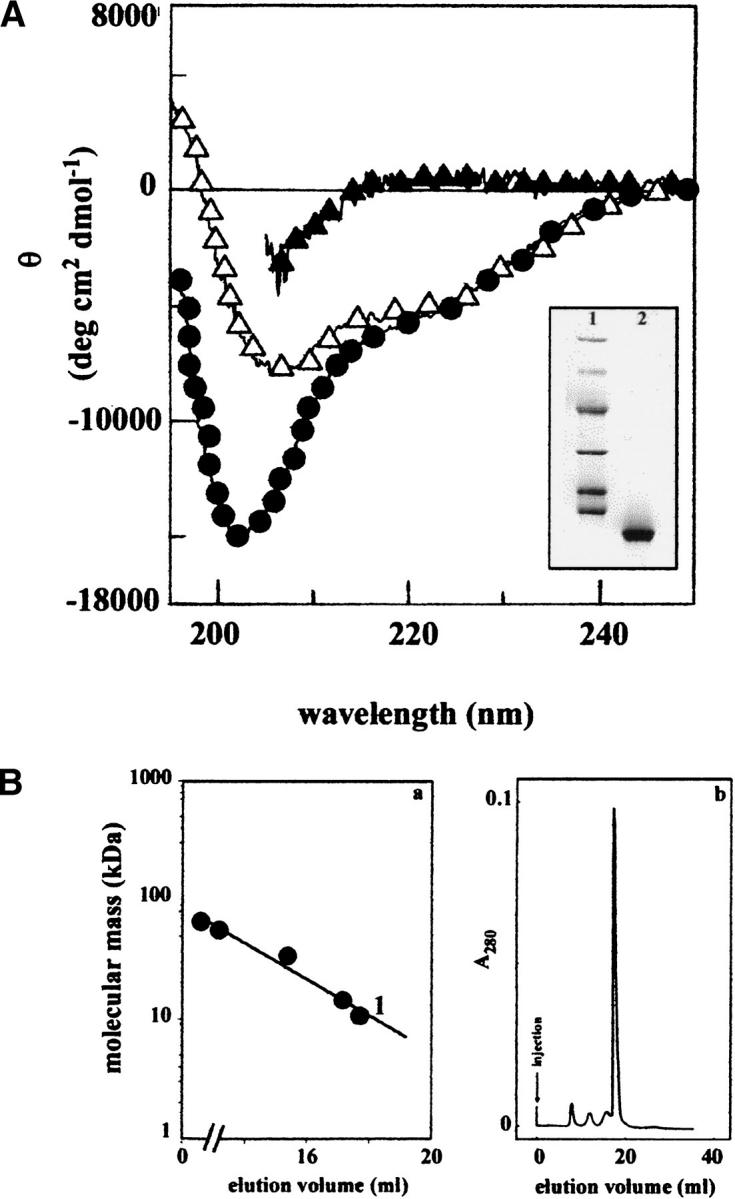
Fig. 6.

(A) CD spectra in the far-UV range of peptide 1–93 purified from PER natural fibrils. Sample in 5 M GdnHCl (filled triangle), in 0.1 M phosphate buffer (pH 7.5; filled circle), and in the presence of phospholipids (open triangle). (Inset) SDS-PAGE analysis of the polypeptide 1–93 used for all of the spectroscopic analysis (lane 2); in lane 1 are reported the molecular mass standards (phosphorylase b = 97.4 kD, bovine serum albumin = 66.2 kD, ovalbumin = 45.0 kD, carbonic anhydrase = 31.0 kD, soybean trypsin inhibitor = 21.5 kD, lysozyme = 14.4 kD). (B) (a) Calibration of gel filtration chromatography. Standard proteins: bovine serum albumin (66.2 kD); transthyretin (55.5 kD); A1 protein (34.2 kD); lysozyme (14.4 kD). 1, apoA1 1–93 (10.7 kD). (b) Gel filtration in 0.1 M phosphate buffer (pH 7.5) of polypeptide 1–93 solubilized from fibrils. The gel filtration was performed on a Superose 12 HR column (Pharmacia) having a bed dimension of 10 × 300 mm. Samples were injected in a volume of 0.5 mL. The apoA1 sample contained approximately 0.1 mg of the polypeptide 1–93.
