Fig. 2.
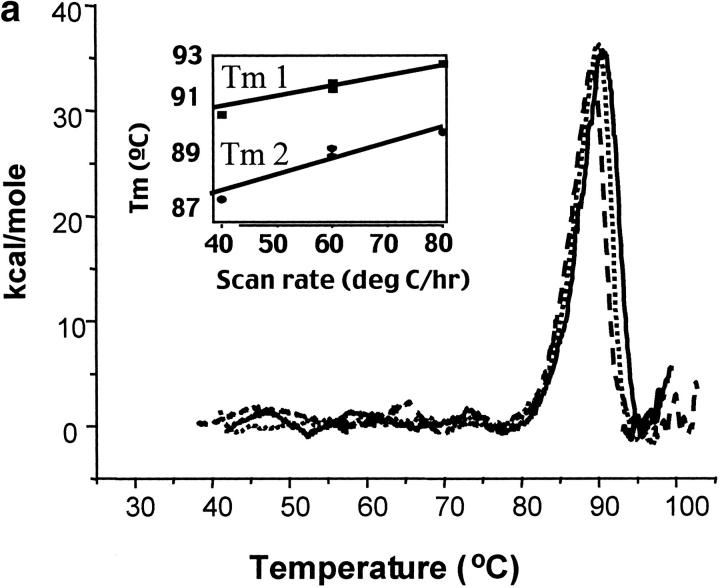
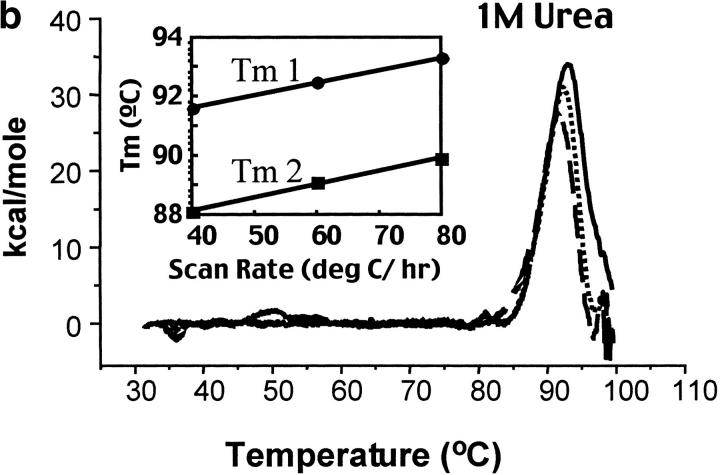
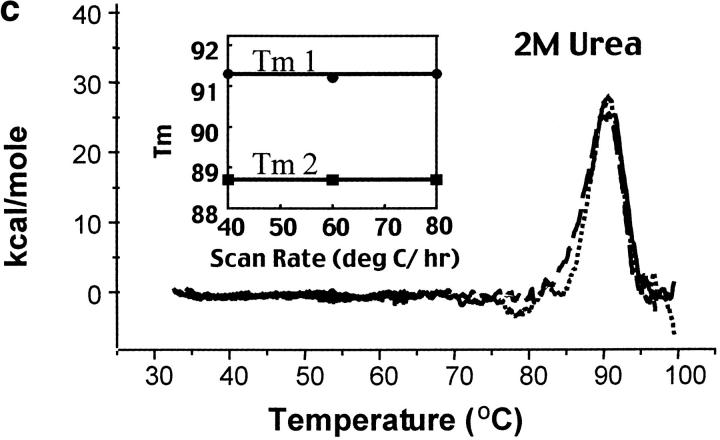
Calorimetric scan rate dependence of CYP-119. Differential scanning calorimetry thermograms (baseline subtracted) of CYP-119 in 100 mM potassium phosphate at pH 6.2 (a), 100 mM potassium phosphate at pH 6.2 and 1 M urea (b), and 100 mM potassium phosphate at pH 6.2 and 2 M urea (c). The solid line was taken with a scan rate of 80°C/h, the dotted line at 60°C/h, and the dashed line at 40°C/h. The inset shows the plot of the melting transition versus the scan rate for melting transitions one and two.


