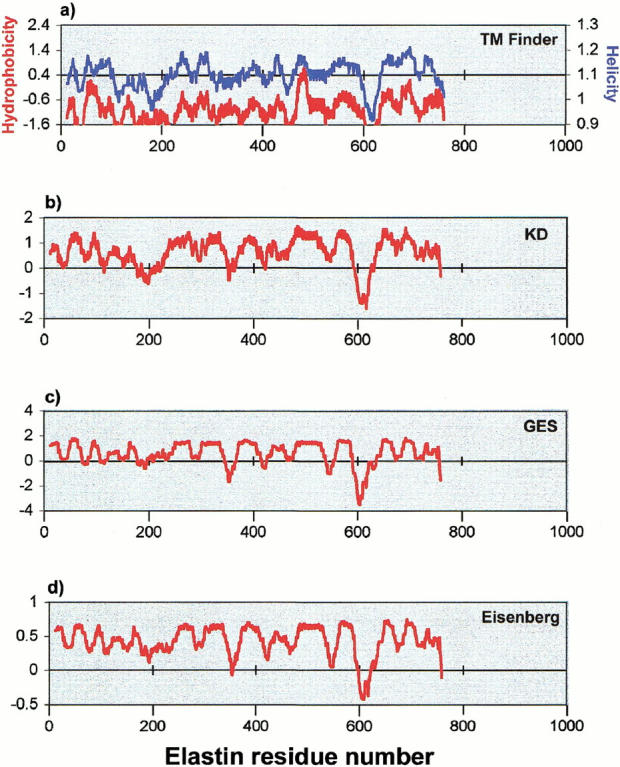
Fig. 3.

Transmembrane segment prediction profiles of human elastin (SWISSPROT accession number: P15502). (a) TM Finder profiles of hydrophobicity (red) and helicity (blue) (Liu and Deber 1998a,b), with the dual threshold shown as a horizontal line drawn through the prediction profiles. Hydrophobicity profiles for the same sequence are also shown for (b) the KD scale (Kyte and Doolittle 1982); (c) the GES scale (Engelman et al. 1986); and (d) the Eisenberg scale (Eisenberg et al. 1984). See text for a further discussion.
