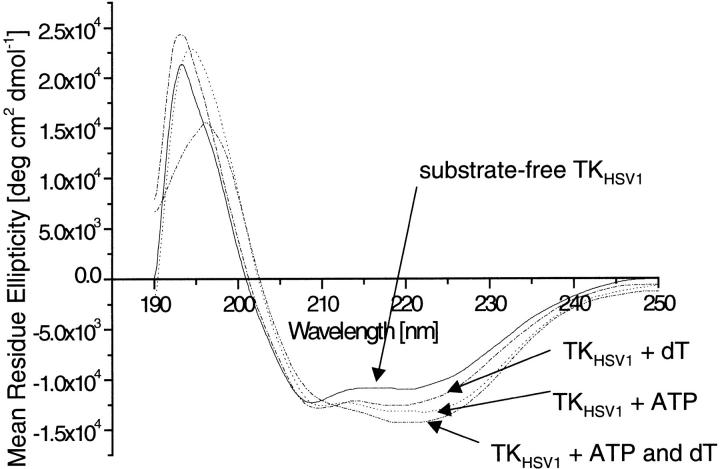
Fig. 1.
Conformational changes of TKHSV1 induced by ligand binding, monitored by far-UV CD spectroscopy. The different spectra resulting from the subtraction of dialysis buffer and ligand spectra from protein spectra are shown. Spectra of TKHSV1 (—), TK with 100 μM ATP (-.-.-), TK with 100 μM dT (. . . . .), and TKHSV1 with 100 μM ATP and dT (-..-).

