
Fig. 3.
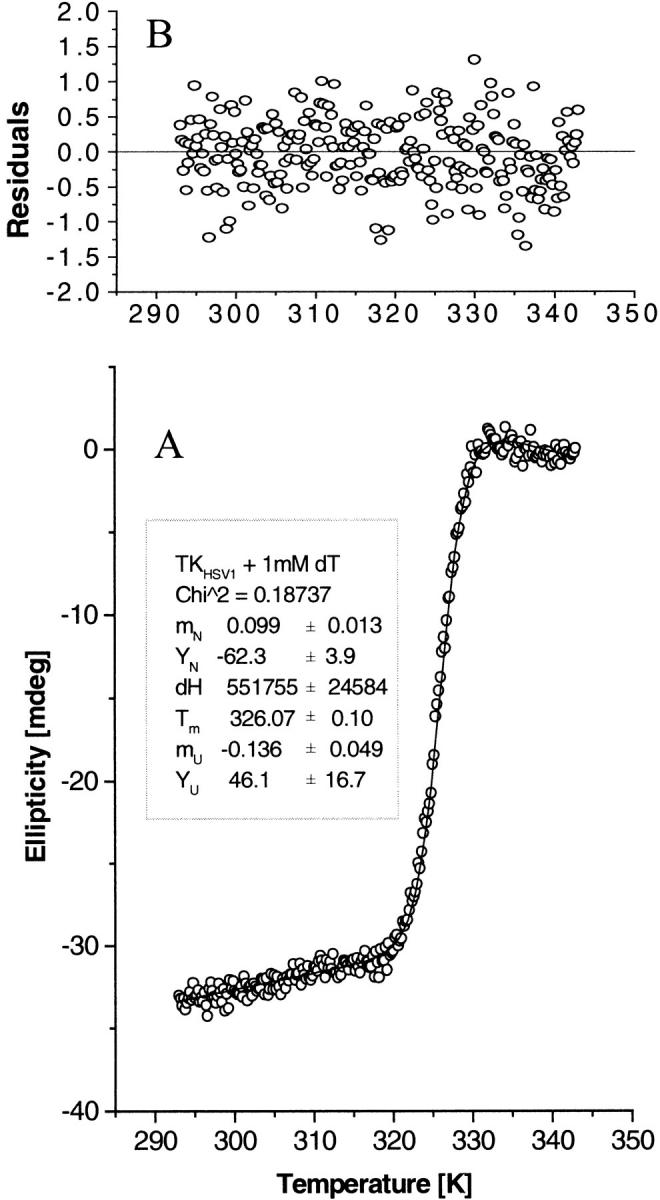
CD thermal denaturation profile analysis. Fit of the CD thermal denaturation profile of TKHSV1 (0.4 mg/mL) in TBSE containing 1 mM dT, as representative of the whole set of measured denaturation curves, to the two-state unfolding model described by Eq. 4b. (A) The open circles represent the CD signal of TKHSV1 at 223 nm as a function of temperature. The solid line is the result of a nonlinear fit routine, fitting the unfolding CD data using Eq. 4b. The inset shows the fit results for the slope mN and intercept YN of the native protein baseline, the melting temperature Tm, the enthalpy change ΔH between the unfolded and the native state (considered only as a mathematical fit parameter, not as thermodynamic value), and slope mU and intercept YU of the unfolded protein baseline. (B) Residuals of the data fit shown in A representing the difference between the theoretical function and the actual data points.