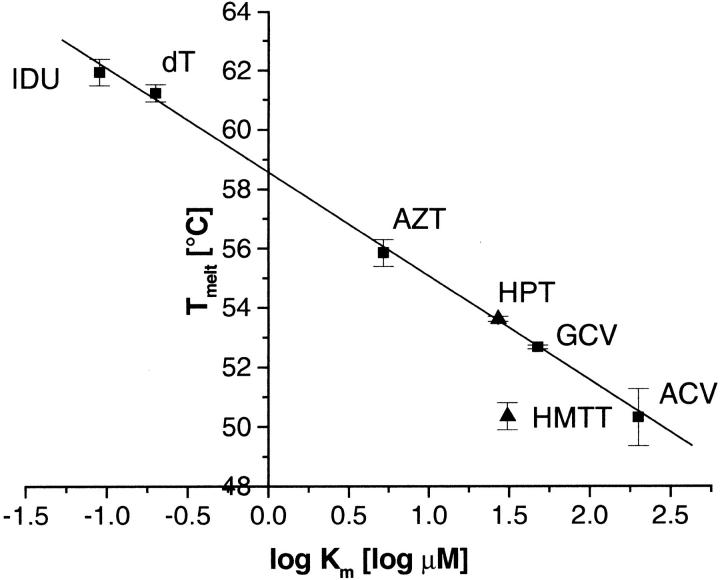
Fig. 4.
Correlation between melting temperature and binding affinity by TKHSV1. Linear relationship between the melting temperature of TKHSV1 (0.4 mg/mL in TBSE) in complex with ATP and different TKHSV1 substrates (each at 1 mM), and the logarithm of the Km value of the substrates ranging over four orders of magnitude and determined by enzyme kinetics. Calibration set: IDU (Ki 0.09 μM; Balzarini et al. 1989), thymidine (Km 0.20 μM; Pilger et al. 1999), AZT (Km 5.2 μM; Pilger et al. 1999), GCV (Km 47.6 μM; Kokoris et al. 1999), and ACV (Km 200 μM; Pilger et al. 1999); test set: HPT (Ki ≅ Km 27 μM), HMTT (Ki ≅ Km 30.9 μM; U. Kessler, B.D. Pilger, O. Zerbe, L. Scapozza, and G. Folkers, unpubl. results). The solid line represents the linear regression calculated for the calibration set (intercept 58.47° ± 0.11°C, slope −3.52 ± 0.08 log μM, r2 = 0.998, P < .001). The resulting Eq. 5 is Tmelt (°C) = −3.52 * log Km (μM) + 58.47.

