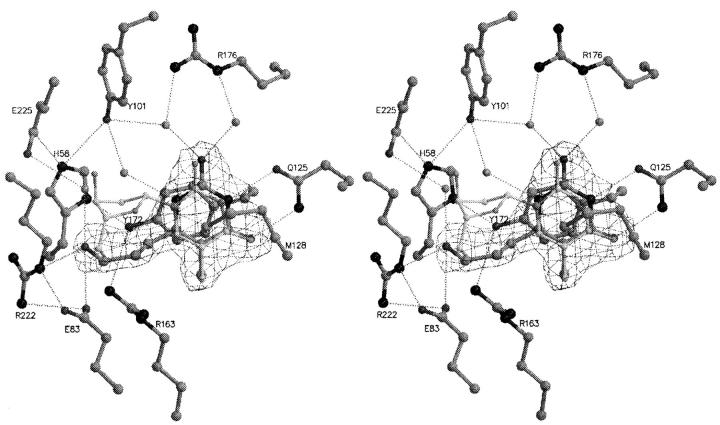
Fig. 6.
Stereo view of HPT binding to TKHSV1 compared to dT in TKHSV1:dT complex. The conformation of HPT is well defined by the (2Fo–Fc) electron density contoured at a contour level of 1.3 σ. TKHSV1:HPT and dT are shown in dark and light gray ball and stick model, respectively. Hydrogen bonds are depicted as dashed lines, water molecules as gray balls. dT is displayed, but the residues of TKHSV1:dT (Champness et al. 1998) taking the same conformation as in the TKHSV1:HPT complex were omitted for clarity. The nucleobase lies between Met128 and Tyr172 in the typical sandwich-like complex and interacts with Gln125 forming a Watson-Crick-like hydrogen- bond network as it is reported for the natural substrate dT (Wild et al. 1997; Champness et al. 1998). In addition, water-mediated hydrogen bonds between O2α and Arg176 and N1 and Tyr101 enhance the binding. The acyclic side chain is fixed similarly to the 5′-OH of dT by the interactions of the OH-group with Glu83, Arg222, and an additional water-mediated hydrogen bond with Glu225.

