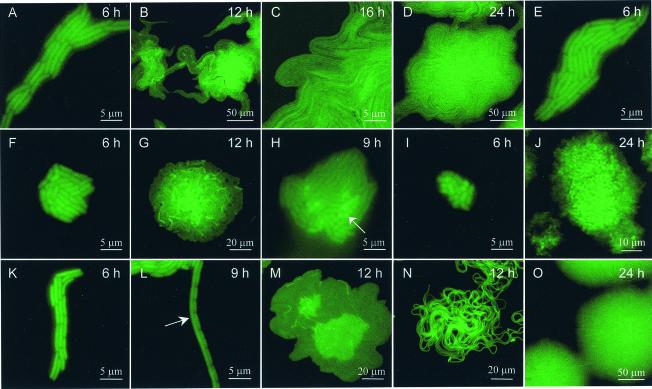
FIG. 1.
Effect of reduced water availability on the temporal dynamics of P. putida mt-2 biofilm development. (A to D) Unamended medium; (E to J) PEG 8000-treated samples (water potentials, −0.25, −0.5, −0.5, −0.75, −1.0, and −1.5 MPa, respectively); (K to M) −0.5-MPa water potential, PEG 200-treated samples; (N to O) −1.5-MPa water potential, NaCl-treated samples. Microcolony age is indicated in the upper right-hand corner of each panel. Arrows highlight circle-shaped (H) or filamented (L) cells. We used a Nikon Instruments Inc. (Melville, N.Y.) EFD-3 epifluorescence microscope with a fluorescein isothiocyanate filter set, and images were taken with a charge-coupled device camera (SPOT camera; Diagnostic Instruments, Sterling Heights, Mich.) or a Leica TCS-NT CSLM equipped with UV and argon lasers (excitation λ = 365 and 488 nm, respectively) for visualization of calcofluor white-stained EPS (emission λ = 425 nm, short-cut filter) and green fluorescent protein (fluorescein isothiocyanate filter set) and collected by using a multitrack mode.

