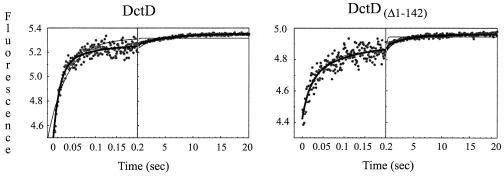
FIG. 4.
Time course of changes in fluorescence upon mixing Mant-ATP with DctD and DctDΔ1-142. Fluorescence was monitored in two time domains (200 data points from 0 to 100 or 200 ms and 300 data points from then until 20 s). The observed rates of reactions were determined by nonlinear least-squares regression to exponential functions using the KinTek Stop Flow or KinTekSim software program (KinTek Corp.). Heavy lines indicate the best-fitting model. Thin lines indicate models that were less complex but displayed larger error or nonrandom residuals (Table 2).

