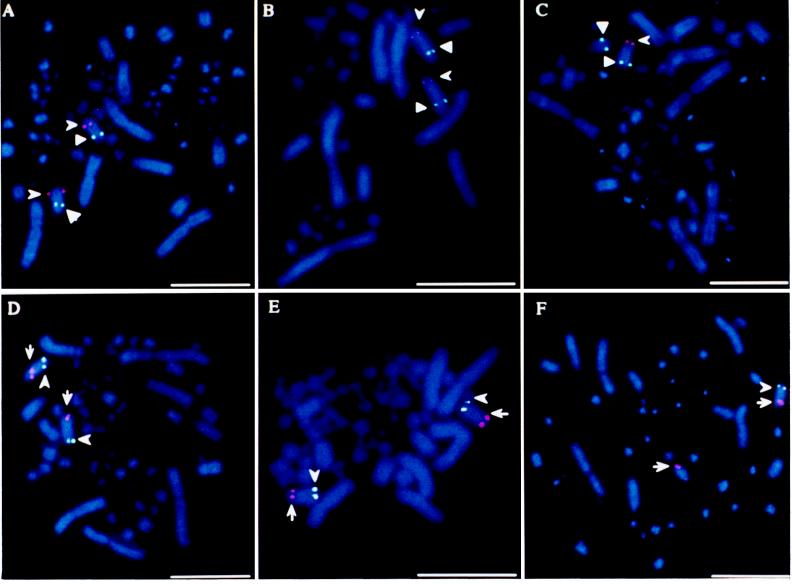
Figure 1.
Localization of IREBP, ZOV3, and EE0.6 sequences on a pair of chromosomes in metaphase sets of the emu and the ostrich. Signals of FISH shown by fluorescein isothiocyanate (white dots) or tetramethylrhodamine isothiocyanate (red dots) fluorescence indicate hybridization of the following probes: (A) DIG-pEGIREBP (arrowhead) and biotinylated pEGZOV3 (triangle) to the female emu set; (B) biotinylated pOGZOV3 (triangle) and DIG-pOGIREBP (arrowhead) to the male ostrich set; (C) as in B, but to the female ostrich set; (D) biotinylated pEGIREBP (arrowhead) and DIG-pEGEE0.6 (arrow) to the female emu set; (E) biotinylated pOGIREBP (arrowhead) and DIG-pOGEE0.6 (arrow) to the male ostrich set; and (F) as in E but to the female ostrich set. (Bars = 10 μm.)

