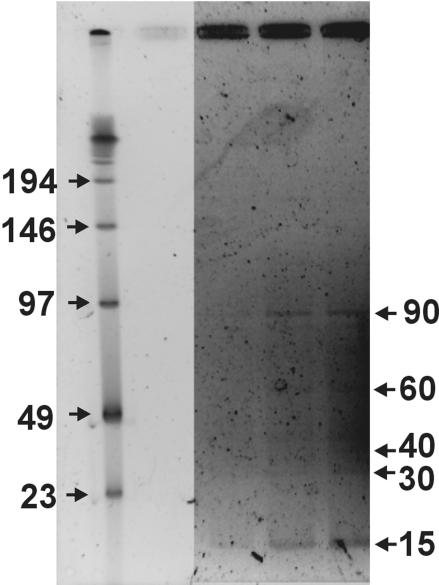
FIG. 3.
Pulsed-field gel displaying the major genome size classes of viruses in the human fecal sample. The three sample lanes (on the right) represent increasing amounts of sample DNA. The DNA ladder is shown in the leftmost lane. The limited amount of DNA made it necessary to enhance the sample bands relative to the ladder by using Corel PHOTO-PAINT. The reported bands were visible by eye on the original gel.

