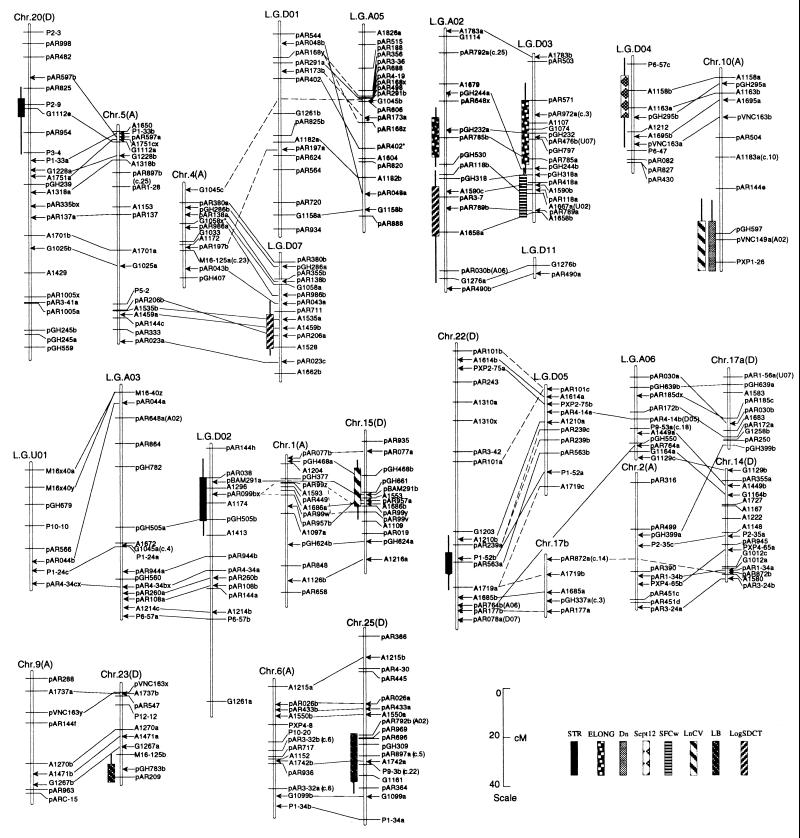
Figure 1.
Likelihood intervals for QTLs mapped. Bars and whiskers indicate 1 lod (10-fold) and 2 lod (100-fold) likelihood intervals. STR, fiber strength; ELONG, fiber elongation; Dn, fiber thickness; Sept12, earliness; SFCw, fiber length; LnCV, CV in mean length of fiber by number; LB, ratio of log(locule number) to log(boll number); LogSDCT, mass of seed cotton. Solid lines connecting probes on different linkage groups indicate homoeologous chromosomal segments supported by three or more pairs of adjacent duplicated loci (15). Dotted lines connecting LGD01, chr4, and LGA05; chr1, chr15, and LGD02; and chr17b, LGD05, and chr22 indicate cases where orthology (homoeology) cannot be distinguished from paralogy (multiple duplication events: see ref. 15). Arrows indicate the inferred locations of markers used to align the homoeologous linkage groups, based on a published map (15). An asterisk denotes loci not on the published map (15). For any duplicated loci that are not consistent with inferred relationships among chromosomes (linkage groups), the homoeologous (or paralogous) loci are indicated in parentheses. Chromosomes/linkage groups that neither contain QTLs nor are homoeologous to regions containing QTLs are not shown.

