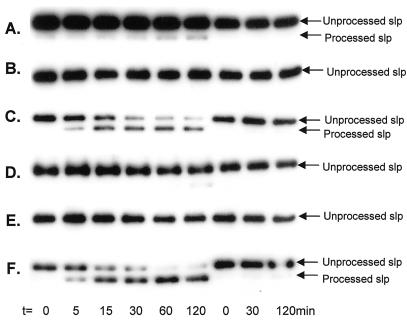
FIG. 4.
Comparison of E. coli signal peptidase and M. voltae signal peptidase activities. The signal peptidase assay was performed as described in the legend to Fig. 2A but with different enzyme sources and NaCl concentrations. The three rightmost lanes in each panel represent the corresponding controls with sterile distilled H2O added in place of membrane preparations. (A) 50 mM NaCl and membrane preparation (40 μg) from E. coli BL21(DE3)/pLysS harboring pET23 alone. (B) 50 mM NaCl and membrane preparation (0.4 μg) from E. coli BL21(DE3)/pLysS harboring pET23 alone. (C) 50 mM NaCl and membrane preparation (0.4 μg) from E. coli BL21(DE3)/pLysS harboring the cloned M. voltae signal peptidase. (D to F) Same conditions as for panels A to C, respectively, except that the NaCl concentration was 1 M. The incubation time of each sample is indicated.

