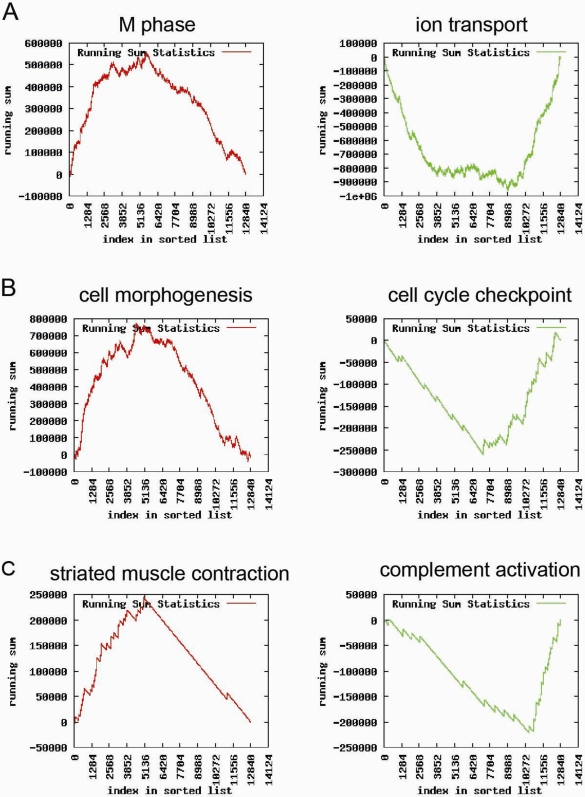
Figure 2. Biological significance of the transcriptional system regulators (TSRs).
The most significant biological processes for either side of the respective TSR according to the GO ontology classification are shown for TSR1, TSR2 and TSR50 in panels A, B and C, respectively. Graphs depict the running sum statistics when applying gene set enrichment analysis. The running sum (y-axis) is shown as a function of the index in the list (x-axis) of genes ranked in ascending order according to their factor loadings within TSR. The red vs. green graphs show the biological coherence of opposing regulated gene clusters controlled by TSRs.

