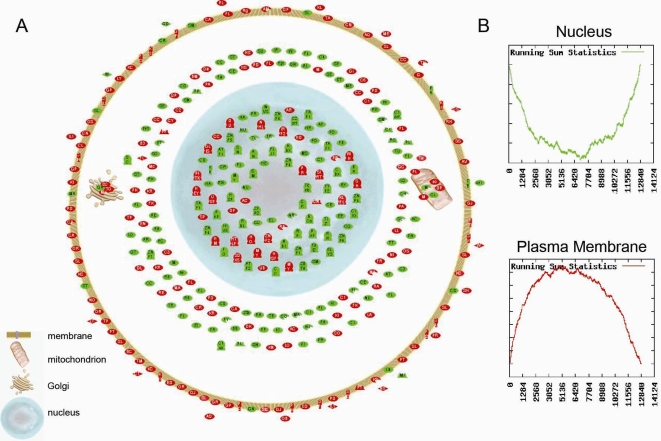
Figure 3. Relationship between cellular localization of genes controlled in opposite directions by TSR1.
Panel A shows the cellular localization of the 400 most strongly controlled genes (highest factor loadings). The colors represent genes with positive (green) and negative (red) factor loadings. Panel B shows the results of gene set enrichment analysis with regard to cellular localization of the gene products. Graphs show the running sum statistics when applying gene set enrichment analysis. The running sum (y-axis) is shown as a function of the index in the list (x-axis) of genes ranked in ascending order according to their factor loadings within a TSR.

