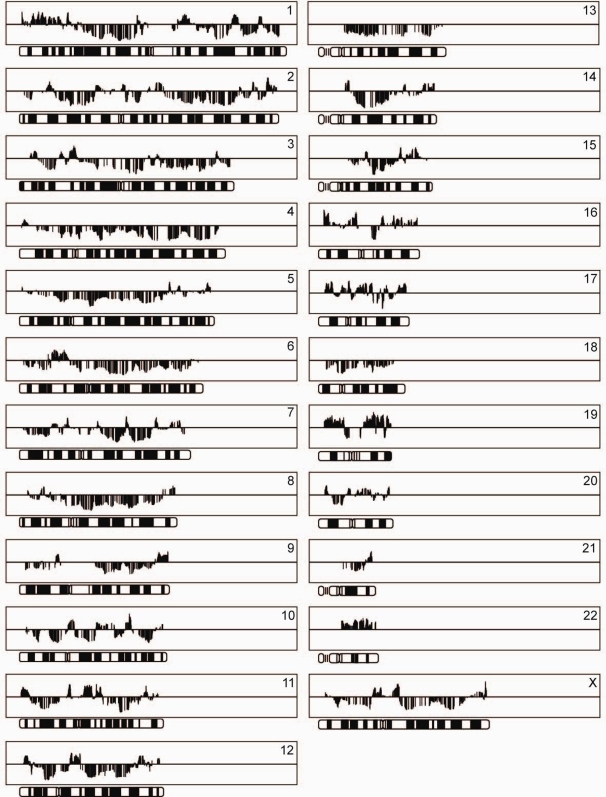
Figure 5. Regional factor loading profiles for 23 chromosomes.
Factor loadings for TSR1 are shown on chromosomes as a moving median with a window size of 20 genes. Chromosome position is depicted on the x-axis and factor loadings for gene regions are given on the y-axis. Bars above or below the middle line represent inversely regulated chromosomal regions.

