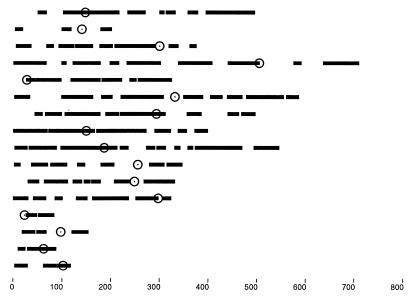
Figure 2.
The duplicated chromosomal regions in a simulated genome with 446 pairs of paralogs retained and 75 reciprocal translocations since duplication. These simulations gave rise to patterns and densities of duplicated blocks that are similar to those mapped in the real data (11). Circles indicate centromeres; bars show duplicated blocks. The scale indicates numbers of genes.

